While specificity is the most important criterion for a great antibody, sensitivity can become important when research samples are limited or a protein is expressed at low endogenous levels. We compared Phospho-GSK-3β (Ser9) (D85E12) XP® Rabbit mAb #5558, and Phospho-S6 Ribosomal Protein (Ser235/236) (D57.2.2E) XP® Rabbit mAb #4858 with competitor products using western blot analysis. We also compared #4858 with other Cell Signaling Technology rabbit monoclonal antibodies #4856 and #4857.
| CST #5558 | Competitor 1 | Competitor 2 | |
|---|---|---|---|
| Western Blot Dilution | 1:1000 | 1:200 | 1:500, 1:250 |
| Assay Concentration (µg/mL) | 0.29 | 0.5 | 1 |
| Recommended Applications | W, IP, IF-IC, F | W, IP | W, IF-IC, F |
| Species Cross-reactivity | H, M, R, Hm | H, M | H |
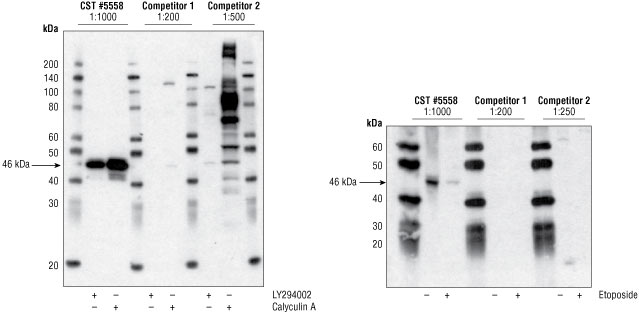
Figure 1. Jurkat cells (left) were either treated with the PI3 Kinase inhibitor LY294002 #9901, which inhibits GSK-3β phosphorylation, or with Calyculin A #9902, which artificially increases phosphorylation levels by inhibiting phosphatases present in cell extracts. For all antibodies, a signal at the appropriate molecular weight (46 kDa) was detected in the calyculin A-treated sample, however, the signal was strongest with #5558. Note: Competitor 2 also shows a significant number of non-specific bands with greater intensity than the appropriate 46 kDa band. Jurkat cells (right) were either left untreated or treated with the apoptosis-inducing reagent, etoposide, a treatment which is known to reduce phosphorylation of GSK-3β. Neither of the competitor products detect phospho-GSK-3β in either the untreated or the etoposide-treated samples.
| CST #4858 | Competitor 1 | |
|---|---|---|
| Western Blot Dilution | 1:2000 | 1:1000 |
| Assay Concentration (µg/mL) | 0.029 | Unknown |
| Recommended Applications | W, IHC-P, IHC-F, IF-IC, F | W |
| Species Cross-reactivity | H, M, R, Mk, Sc, (C) | H, (R) |
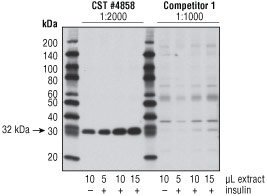
Figure 2. Serial dilutions of extracts from untreated or insulin-treated NIH/3T3 cells (100 nM, 10 min) were detected with #4858 at 1:2000 dilution and the lowest dilution within the manufacturer’s recommended range for the competitor antibody (1:1000). The stronger signal was observed using #4858, with the signal of the competitor antibody barely visible in the lanes with lowest amounts of extract or the untreated lane (which contains basal levels of phospho-S6). Note: The competitor antibody displays cross-reacting bands that are stronger than the band of appropriate molecular weight, showing the lack of specificity of this product.
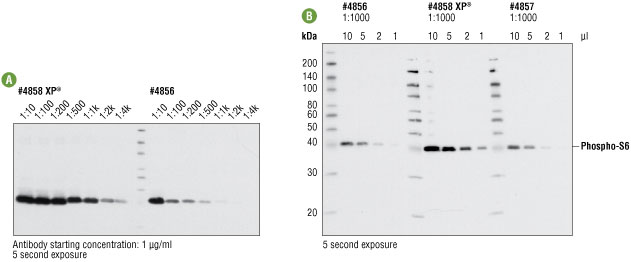
Figure 3A. Western blot analysis of extracts from insulin-treated HeLa cells using serial antibody dilutions of #4858 and #4856, starting at 1 μg/ml. Both antibodies generate a clean and specific signal. However, a much more intense signal was observed with #4858. On the 5 second exposure shown, #4858 generates a strong signal at 1 ng/ml, while the signal from #4856 is much weaker.
Figure 3B. Western blot analysis of a serial dilution of extracts from insulin-treated HeLa cells (100 nM, 10 min) detected with CST selling stocks of #4858, #4856 and #4857 at 1:1000 dilution. Again, the strongest signal was observed using #4858.
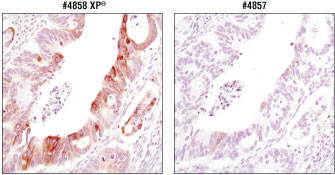
Figure 4. Immunohistochemical analysis of paraffin-embedded colon carcinoma using #4858 and #4857 at matched concentrations (80 ng/ml). While both antibodies generate a specific signal, dramatically greater signal strength was observed using #4858.
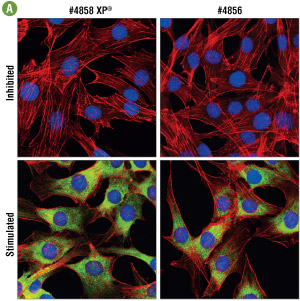
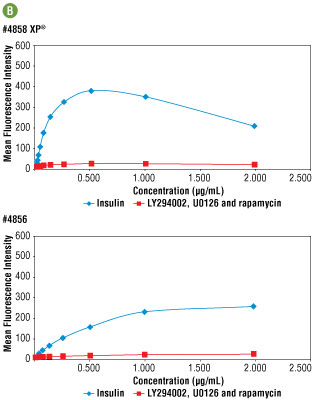
Figure 5A. Confocal immunofluorescent analysis of C6 cells, LY294002 #9901, U0126 #9903, and rapamycin-treated for 2 hours (upper) or insulin-treated (100 nM, 30 min; lower), using #4858 (left) or #4856 (right). Actin filaments were labeled with Alexa Fluor® 555 phalloidin (red). Blue pseudocolor = DRAQ5 #4084 (fluorescent DNA dye). At optimal concentration (0.25 μg/ml), #4858 appears to generate a stronger signal. For numerical values see Figure 5B.
Figure 5B. Side by side immunofluorescent titration analysis comparing #4858 with #4856. Optimal concentration for both antibodies was determined to be 0.25 μg/ml. At this concentration signal brightness was 2 fold higher with #4858, demonstrating greater sensitivity.
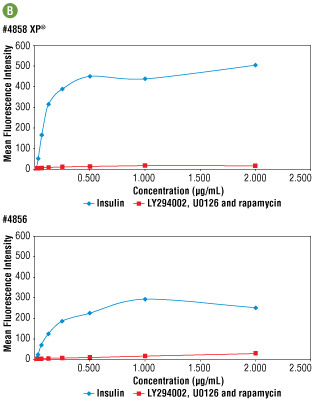
Figure 6A. Flow cytometric analysis of Jurkat cells, untreated (grey fill) or treated with LY294002 #9901, wortmannin #9951, and U0126 #9903 (no fill), using #4858 (left) and #4856 (right) at optimal concentration (0.25 and 0.5 μg/ml, respectively).
Figure 6B. Side by side immunofluorescent titration analysis comparing #4858 with #4856. Optimal concentration was determined as 0.25 and 0.5 μg/ml, for #4858 and #4856, respectively. At these concentrations signal brightness was almost 2 fold higher using #4858. Moreover, fold induction over control was also nearly 2 fold higher (not shown). These results indicate greater sensitivity of #4858 by flow cytometry.