View Featured Offers >>
9130
PhosphoPlus® Stat3 (Tyr705) Antibody Kit
Primary Antibodies
PhosphoPlus Antibody Kit

PhosphoPlus® Stat3 (Tyr705) Antibody Kit #9130

Citations (0)
CUT&RUN was performed with Hep G2 cells starved overnight and treated with IL-6 (100 ng/ml) for 30 minutes, and Stat3 (124H6) Mouse mAb, using CUT&RUN Assay Kit #86652. DNA Library was prepared using DNA Library Prep Kit for Illumina (ChIP-seq, CUT&RUN) #56795. The figures show binding across BRD8 gene, a known target gene of Stat3 (see additional figure containing CUT&RUN-qPCR data).
CUT&RUN was performed with Hep G2 cells starved overnight and treated with IL-6 (100 ng/ml) for 30 minutes, and Stat3 (124H6) Mouse mAb, using CUT&RUN Assay Kit #86652. DNA Libraries were prepared using DNA Library Prep Kit for Illumina (ChIP-seq, CUT&RUN) #56795. The figures show binding across chromosome 5 (upper), including BRD8 gene (lower), a known target gene of Stat3 (see additional figure containing CUT&RUN-qPCR data).
CUT&RUN was performed with Hep G2 cells starved overnight and treated with IL-6 (100 ng/ml) for 30 minutes and either Stat3 (124H6) Mouse mAb or Rabbit (DA1E) mAb IgG XP® Isotype Control (CUT&RUN) #66362, using CUT&RUN Assay Kit #86652. The enriched DNA was quantified by real-time PCR using human BRD8 promoter primers and human PAIS3 upstream primers. The amount of immunoprecipitated DNA in each sample is represented as signal relative to the total amount of input chromatin, which is equivalent to one.
Immunoprecipitation of Stat3 from HeLa cell extracts. Lane 1 is 10% input, lane 2 is precipitated with Mouse (G3A1) mAb IgG1 Isotype Control #5415, and lane 3 is Stat3 (124H6) Mouse mAb, #9139.
Simple Western™ analysis of lysates (1 mg/mL) from serum-starved HeLa cells treated with interferon-alpha (100 ng/mL, 5”) using Stat3 (124H6) Mouse mAb #9139. The virtual lane view (left) shows a single target band (as indicated) at 1:10 and 1:50 dilutions of primary antibody. The corresponding electropherogram view (right) plots chemiluminescence by molecular weight along the capillary at 1:10 (blue line) and 1:50 (green line) dilutions of primary antibody. This experiment was performed under reducing conditions on the Jess™ ​​​​​​​ Simple Western instrument from ProteinSimple, a BioTechne brand, using the 12-230 kDa separation module.
Western blot analysis of extracts from HeLa cells, untreated or treated with IFNa (#36000, 100 ng/mL, 5 min) or IFNg (#80385, 100 ng/mL, 30 min); using Phospho-Stat3 (Tyr705) (D3A7) XP® Rabbit mAb #9145 (upper), Stat3 (D3Z2G) Rabbit mAb #12640 (middle), and β-Actin (D6A8) Rabbit mAb #8457 (lower).
Simple Western™ analysis of lysates (0.1 mg/mL) from serum-starved HeLa cells treated with IFN-alpha (100 ng/mL, 5 min) using Phospho-Stat3 (Tyr705) (D3A7) XP® Rabbit mAb #9145. The virtual lane view (left) shows a single target band (as indicated) at 1:10 and 1:50 dilutions of primary antibody. The corresponding electropherogram view (right) plots chemiluminescence by molecular weight along the capillary at 1:10 (blue line) and 1:50 (green line) dilutions of primary antibody. This experiment was performed under reducing conditions on the Jess™ Simple Western instrument from ProteinSimple, a BioTechne brand, using the 12-230 kDa separation module.
After the primary antibody is bound to the target protein, a complex with HRP-linked secondary antibody is formed. The LumiGLO® is added and emits light during enzyme catalyzed decomposition.
After the primary antibody is bound to the target protein, a complex with HRP-linked secondary antibody is formed. The LumiGLO* is added and emits light during enzyme catalyzed decomposition.
Western blot analysis of extracts from HeLa cells, untreated (-) or treated with IFN-alpha (100 ng/ml) for 5 min, using Stat1 (D1K9Y) Rabbit mAb #14994 (upper) and P-Stat1 (Tyr701) (58D6) Rabbit mAb #9167 (lower).
Western blot analysis of extracts from various human cell lines using Stat3 (124H6) Mouse mAb #9139 (upper) or β-Actin (8H10D10) Mouse mAb #3700 (lower).
Immunohistochemical analysis of paraffin-embedded human prostate adenocarcinoma using Stat3 (124H6) Mouse mAb performed on the Leica BOND RX.
Western blot analysis of extracts from IFN-alpha treated Jurkat cells and HeLa cells (left), as well as EGF treated A431 cells (right), using Phospho-Stat3 (Tyr705) (D3A7) XP® Rabbit mAb. Note that the basal phospho-Stat3 in A431 is detected by the antibody.
Western blot analysis of extracts from HeLa cells, untreated (-) or treated with IFN-alpha (100 ng/ml) for 5 min, using Stat3 (D3Z2G) Rabbit mAb #12640 (upper) and P-Stat3 (Tyr705) (D3A7) XP Rabbit mAb #9145 (lower).
Western blot analysis of extracts from various rodent and monkey samples using Stat3 (124H6) Mouse mAb #9139 (upper) or β-Actin (8H10D10) Mouse mAb #3700 (lower).
Immunohistochemical analysis of paraffin-embedded human squamous cell lung carcinoma using Stat3 (124H6) Mouse mAb performed on the Leica BOND RX.
Immunoprecipitation of phospho-Stat3 (Tyr705) from U266 extracts treated with human IFN-α (50 ng/ml, 15 min). Lane 1 is 10% input, lane 2 is Rabbit (DA1E) mAb IgG XP® Isotype Control #3900, and lane 3 is Phospho-Stat3 (Tyr705) (D3A7) XP® Rabbit mAb. Western blot analysis was performed using Phospho-Stat3 (Tyr705) (3E2) Mouse mAb #9138. Anti-mouse IgG, HRP-linked Antibody #7076 was used as a secondary antibody.
Western blot analysis of extracts from HeLa cells, untreated (-) or treated with IFN-alpha (100 ng/ml) for 5 min, using Stat5 (D2O6Y) Rabbit mAb #94205 (upper) and P-Stat5 (Tyr694) (D47E7) Rabbit mAb #4322 (lower).
Immunohistochemical analysis of paraffin-embedded human breast carcinoma (left), showing nuclear and cytoplasmic staining, and human lung carcinoma (right), showing cytoplasmic staining, using Stat3 (124H6) Mouse mAb.
Immunohistochemical analysis of paraffin-embedded human hepatocellular carcinoma using Stat3 (124H6) Mouse mAb performed on the Leica BOND RX.
Immunohistochemical analysis of paraffin-embedded human prostate adenocarcinoma using Phospho-Stat3 (Tyr705) (D3A7) XP® Rabbit mAb performed on the Leica® BOND Rx.
Confocal immunofluorescent analysis of HeLa cells either serum-starved (left) or IFNalpha-treated (right) and labeled with Stat3 (124H6) Mouse mAb (green).
Immunohistochemical analysis of paraffin-embedded human papillary carcinoma of the breast using Stat3 (124H6) Mouse mAb performed on the Leica BOND RX.
Immunohistochemical analysis of paraffin-embedded human neuroendocrine lung carcinoma using Phospho-Stat3 (Tyr705) (D3A7) XP® Rabbit mAb performed on the Leica® BOND Rx.
Flow cytometric analysis of PC-3 cells (blue) and HeLa cells (green) using Stat3 (124H6) Mouse mAb (solid lines) or a concentration-matched Mouse (G3A1) mAb IgG1 Isotype Control #5415 (dashed lines). Anti-mouse IgG (H+L), F(ab')2 Fragment (Alexa Fluor® 488 Conjugate) #4408 was used as a secondary antibody.
Immunohistochemical analysis of paraffin-embedded Apc (min/+) mouse intestine, using Phosho-Stat3 (Tyr705) (D3A7) XP® Rabbit mAb.
Chromatin immunoprecipitations were performed with cross-linked chromatin from Hep G2 cells starved overnight and treated with IL-6 (100 ng/ml) for 30 minutes, and either Stat3 (124H6) Mouse mAb or Normal Rabbit IgG #2729 using SimpleChIP® Enzymatic Chromatin IP Kit (Magnetic Beads) #9003. The enriched DNA was quantified by real-time PCR using human IRF-1 promoter primers, SimpleChIP® Human c-Fos Promoter Primers #4663, and SimpleChIP® Human α Satellite Repeat Primers #4486. The amount of immunoprecipitated DNA in each sample is represented as signal relative to the total amount of input chromatin, which is equivalent to one.
Immunnohistochemical analysis of paraffin-embedded human lung carcinoma, showing nuclear localization, using Phospho-Stat3 (Tyr705) (D3A7) XP® Rabbit mAb.
Immunohistochemical analysis of paraffin embedded human breast carcinoma, specifically endothelial cells, untreated (left) or lambda phosphatase treated (right), using Phospho-Stat3 (Tyr705) (D3A7) XP® Rabbit mAb.
Immunohistochemical analysis using Phospho-Stat3 (Tyr705) (D3A7) XP® Rabbit mAb on SignalSlide® HeLa -/+ IFNa IHC Controls #55861 (paraffin-embedded HeLa cell pellets, untreated (left) or treated with Human Interferon-α1 (hIFN-α1) #8927 (right)).
Confocal immunofluorescent analysis of HeLa cells, IFN-alpha treated (left) or untreated (right), labeled with Phospho-Stat3 (Tyr705) (D3A7) XP® Rabbit mAb (green).
Flow cytometric analysis of U266 cells, untreated (blue) or treated with IFNalpha (50 ng/ml, 15 min; green) using Phospho-Stat3 (Tyr705) (D3A7) XP® Rabbit mAb (solid lines) or concentration matched Rabbit (DA1E) mAb IgG XP® Isotype Control #3900 (dashed lines). Anti-rabbit IgG (H+L), F(ab')2 Fragment (Alexa Fluor® 488 Conjugate) #4412 was used as a secondary antibody.
Chromatin immunoprecipitations were performed with cross-linked chromatin from Hep G2 cells starved overnight and treated with IL-6 (100 ng/ml) for 30 minutes and Phospho-Stat3 (Tyr705) (D3A7) XP® Rabbit mAb, using SimpleChIP® Plus Enzymatic Chromatin IP Kit (Magnetic Beads) #9005. DNA Libraries were prepared using DNA Library Prep Kit for Illumina® (ChIP-seq, CUT&RUN) #56795. The figure shows binding across IRF1, a known target gene of Phospho-Sata3 (see additional figure containing ChIP-qPCR data). For additional ChIP-seq tracks, please download the product datasheet.
Chromatin immunoprecipitations were performed with cross-linked chromatin from HaCaT cells Hep G2 cells starved overnight and treated with IL-6 (100 ng/ml) for 30 minutes and either Phospho-Stat3 (Tyr705) (D3A7) XP® Rabbit mAb or Normal Rabbit IgG #2729 using SimpleChIP® Plus Sonication Chromatin IP Kit #56383. The enriched DNA was quantified by real-time PCR using SimpleChIP® Human c-Fos Promoter Primers #4663, human IRF1 promoter primers, and SimpleChIP® Human α Satellite Repeat Primers #4486. The amount of immunoprecipitated DNA in each sample is represented as signal relative to the total amount of input chromatin, which is equivalent to one.
Chromatin immunoprecipitations were performed with cross-linked chromatin from Hep G2 cells starved overnight and treated with IL-6 (100 ng/ml) for 30 minutes, and either Phospho-Stat3 (Tyr705) (D3A7) XP® Rabbit mAb or of Normal Rabbit IgG #2729 using SimpleChIP® Enzymatic Chromatin IP Kit (Magnetic Beads) #9003. The enriched DNA was quantified by real-time PCR using human IRF-1 promoter primers, SimpleChIP® Human c-Fos Promoter Primers #4663, and SimpleChIP® Human α Satellite Repeat Primers #4486. The amount of immunoprecipitated DNA in each sample is represented as signal relative to the total amount of input chromatin, which is equivalent to one.
Inquiry Info.# 9130

Specificity / Sensitivity

Phospho-Stat3 (Tyr705) (D3A7) XP® Rabbit mAb detects endogenous levels of Stat3 only when phosphorylated at tyrosine 705. This antibody does not cross-react with phospho-EGFR or the corresponding phospho-tyrosines of other Stat proteins. Stat3 (124H6) Mouse mAb detects endogenous levels of total Stat3 protein.

Source / Purification

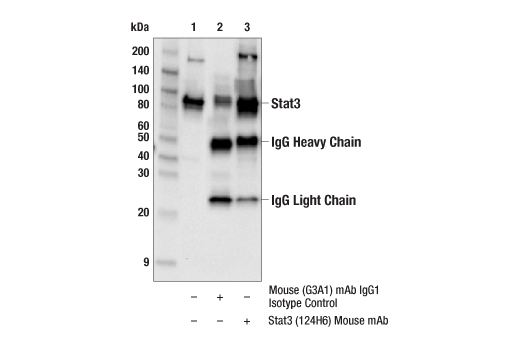
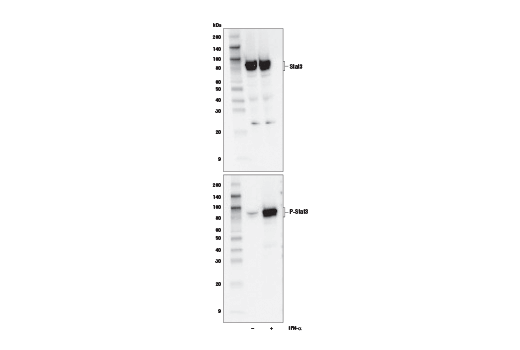
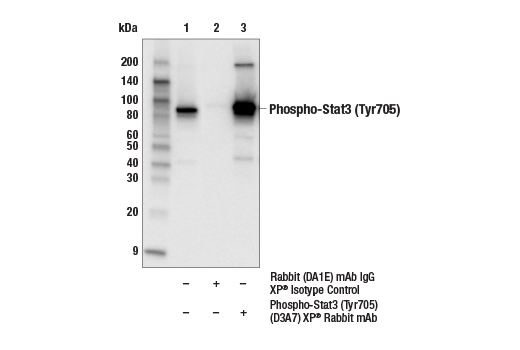
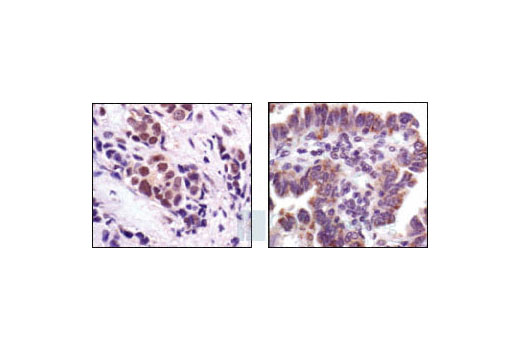
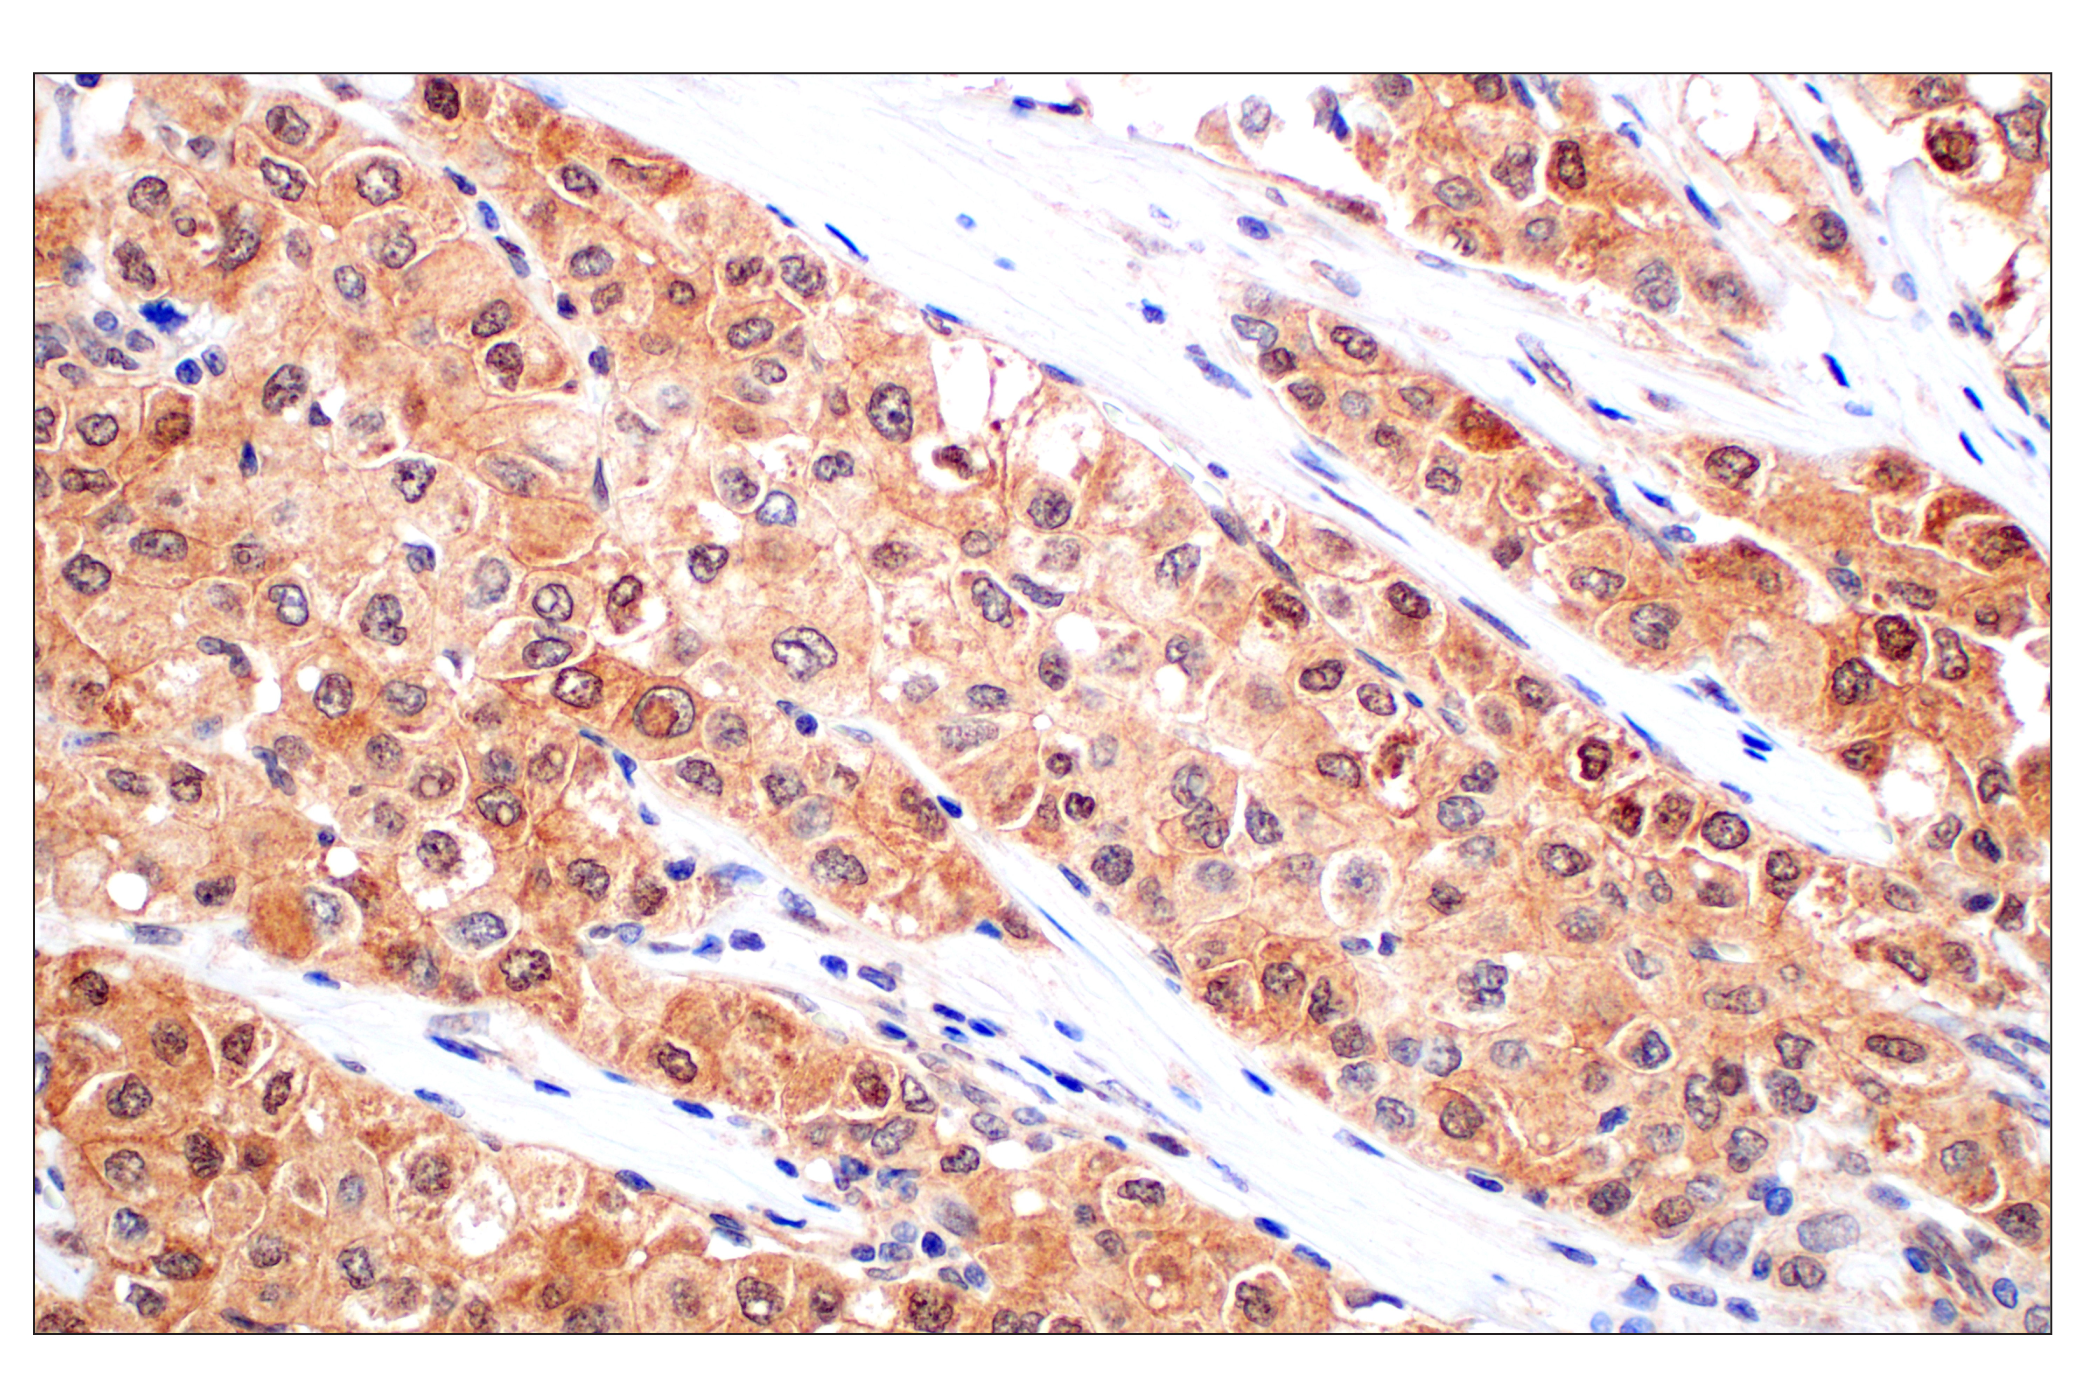
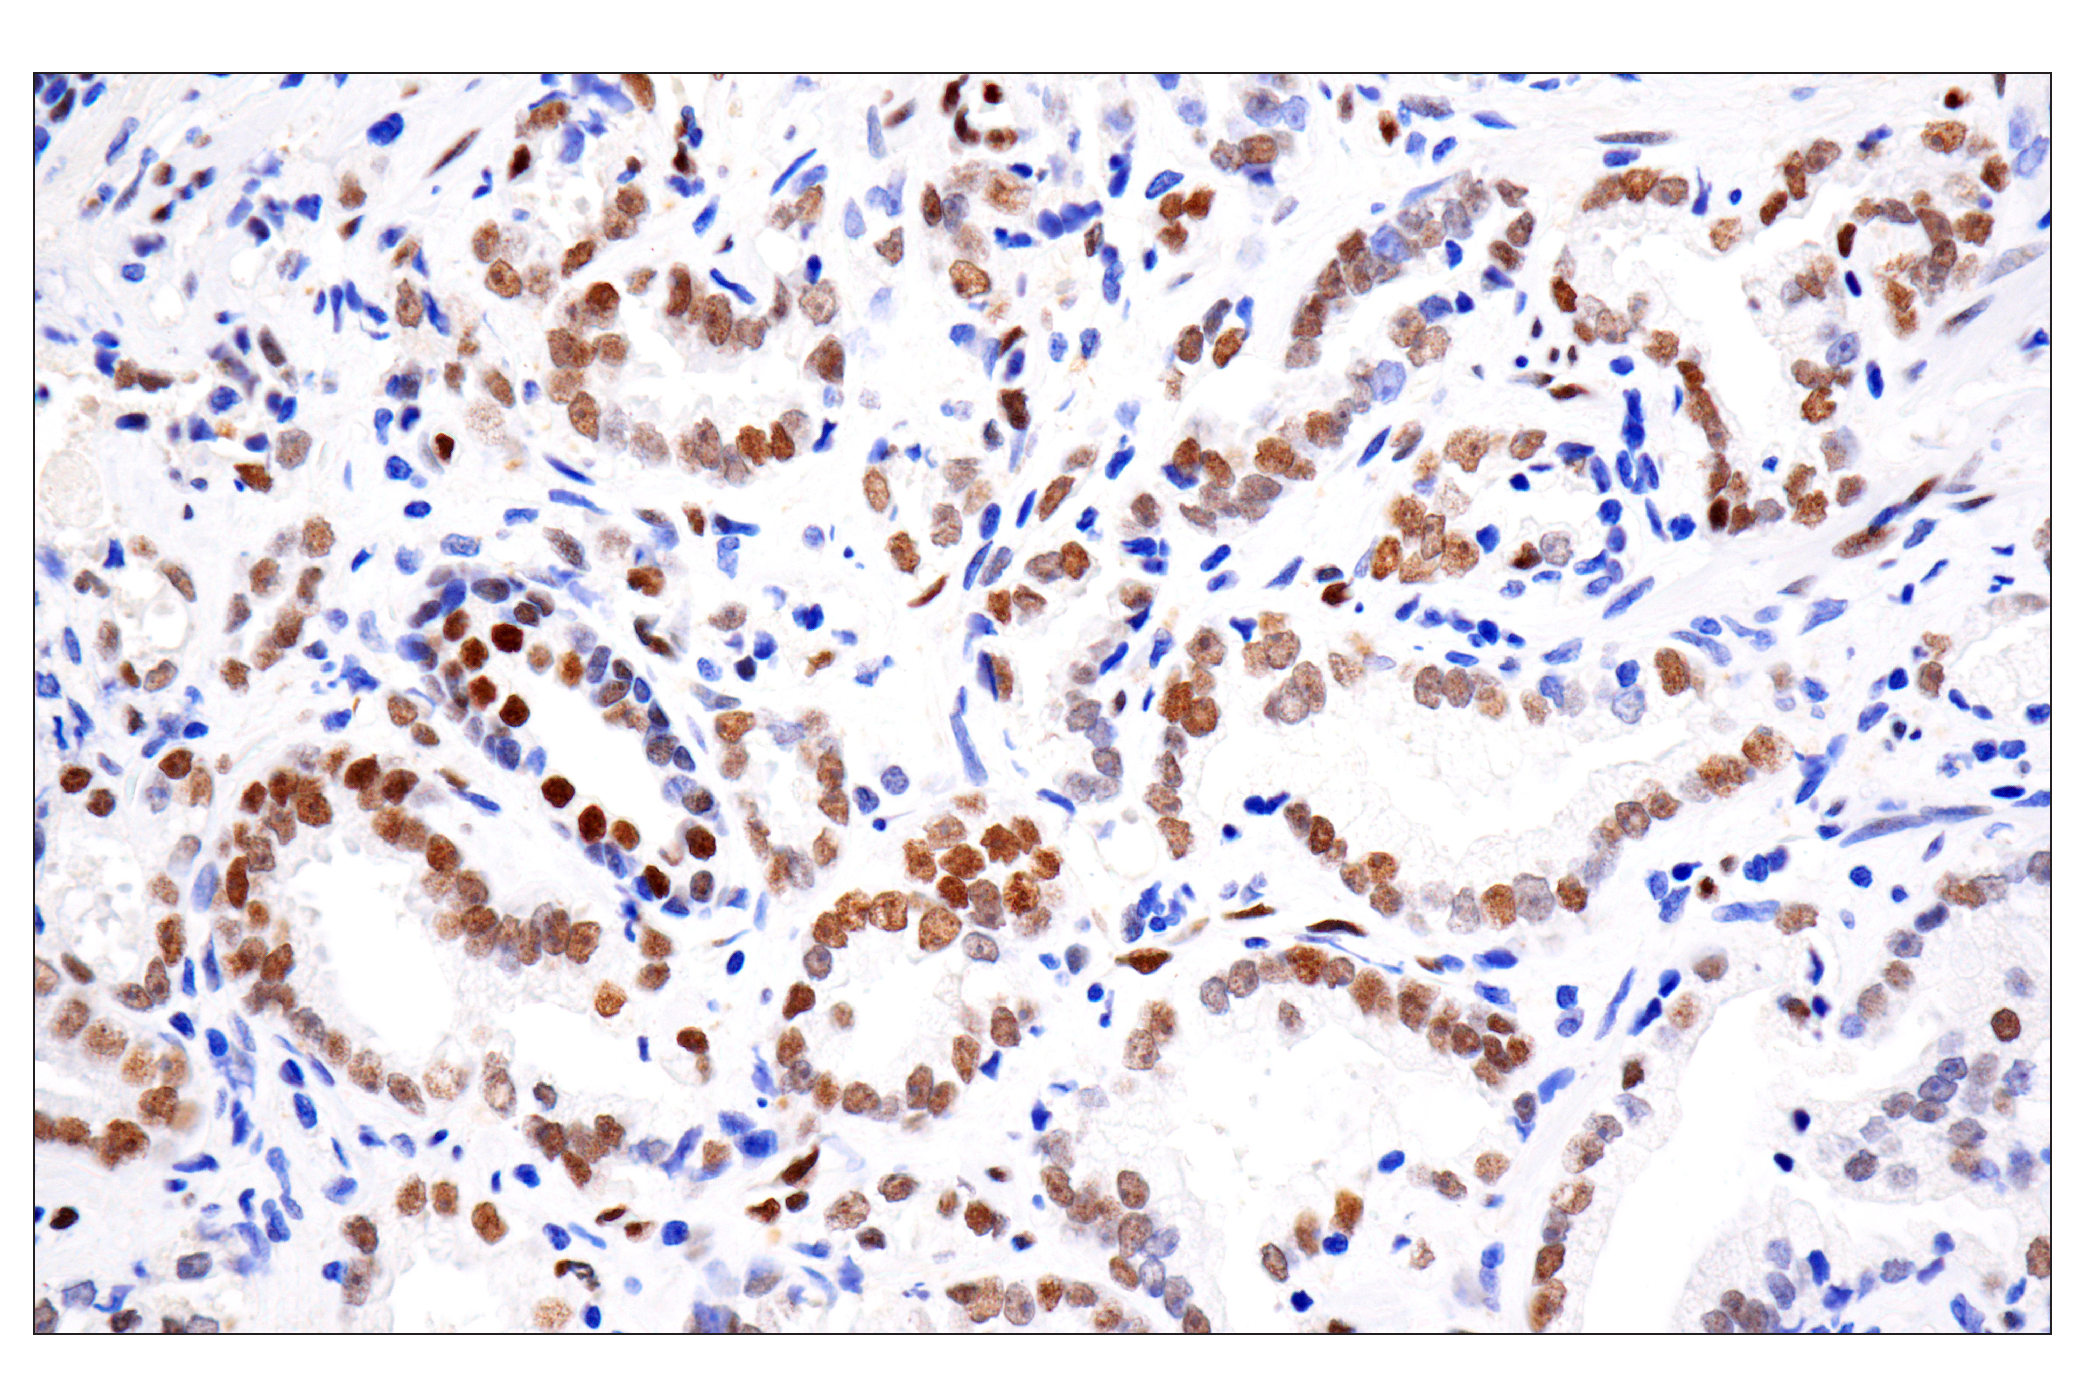
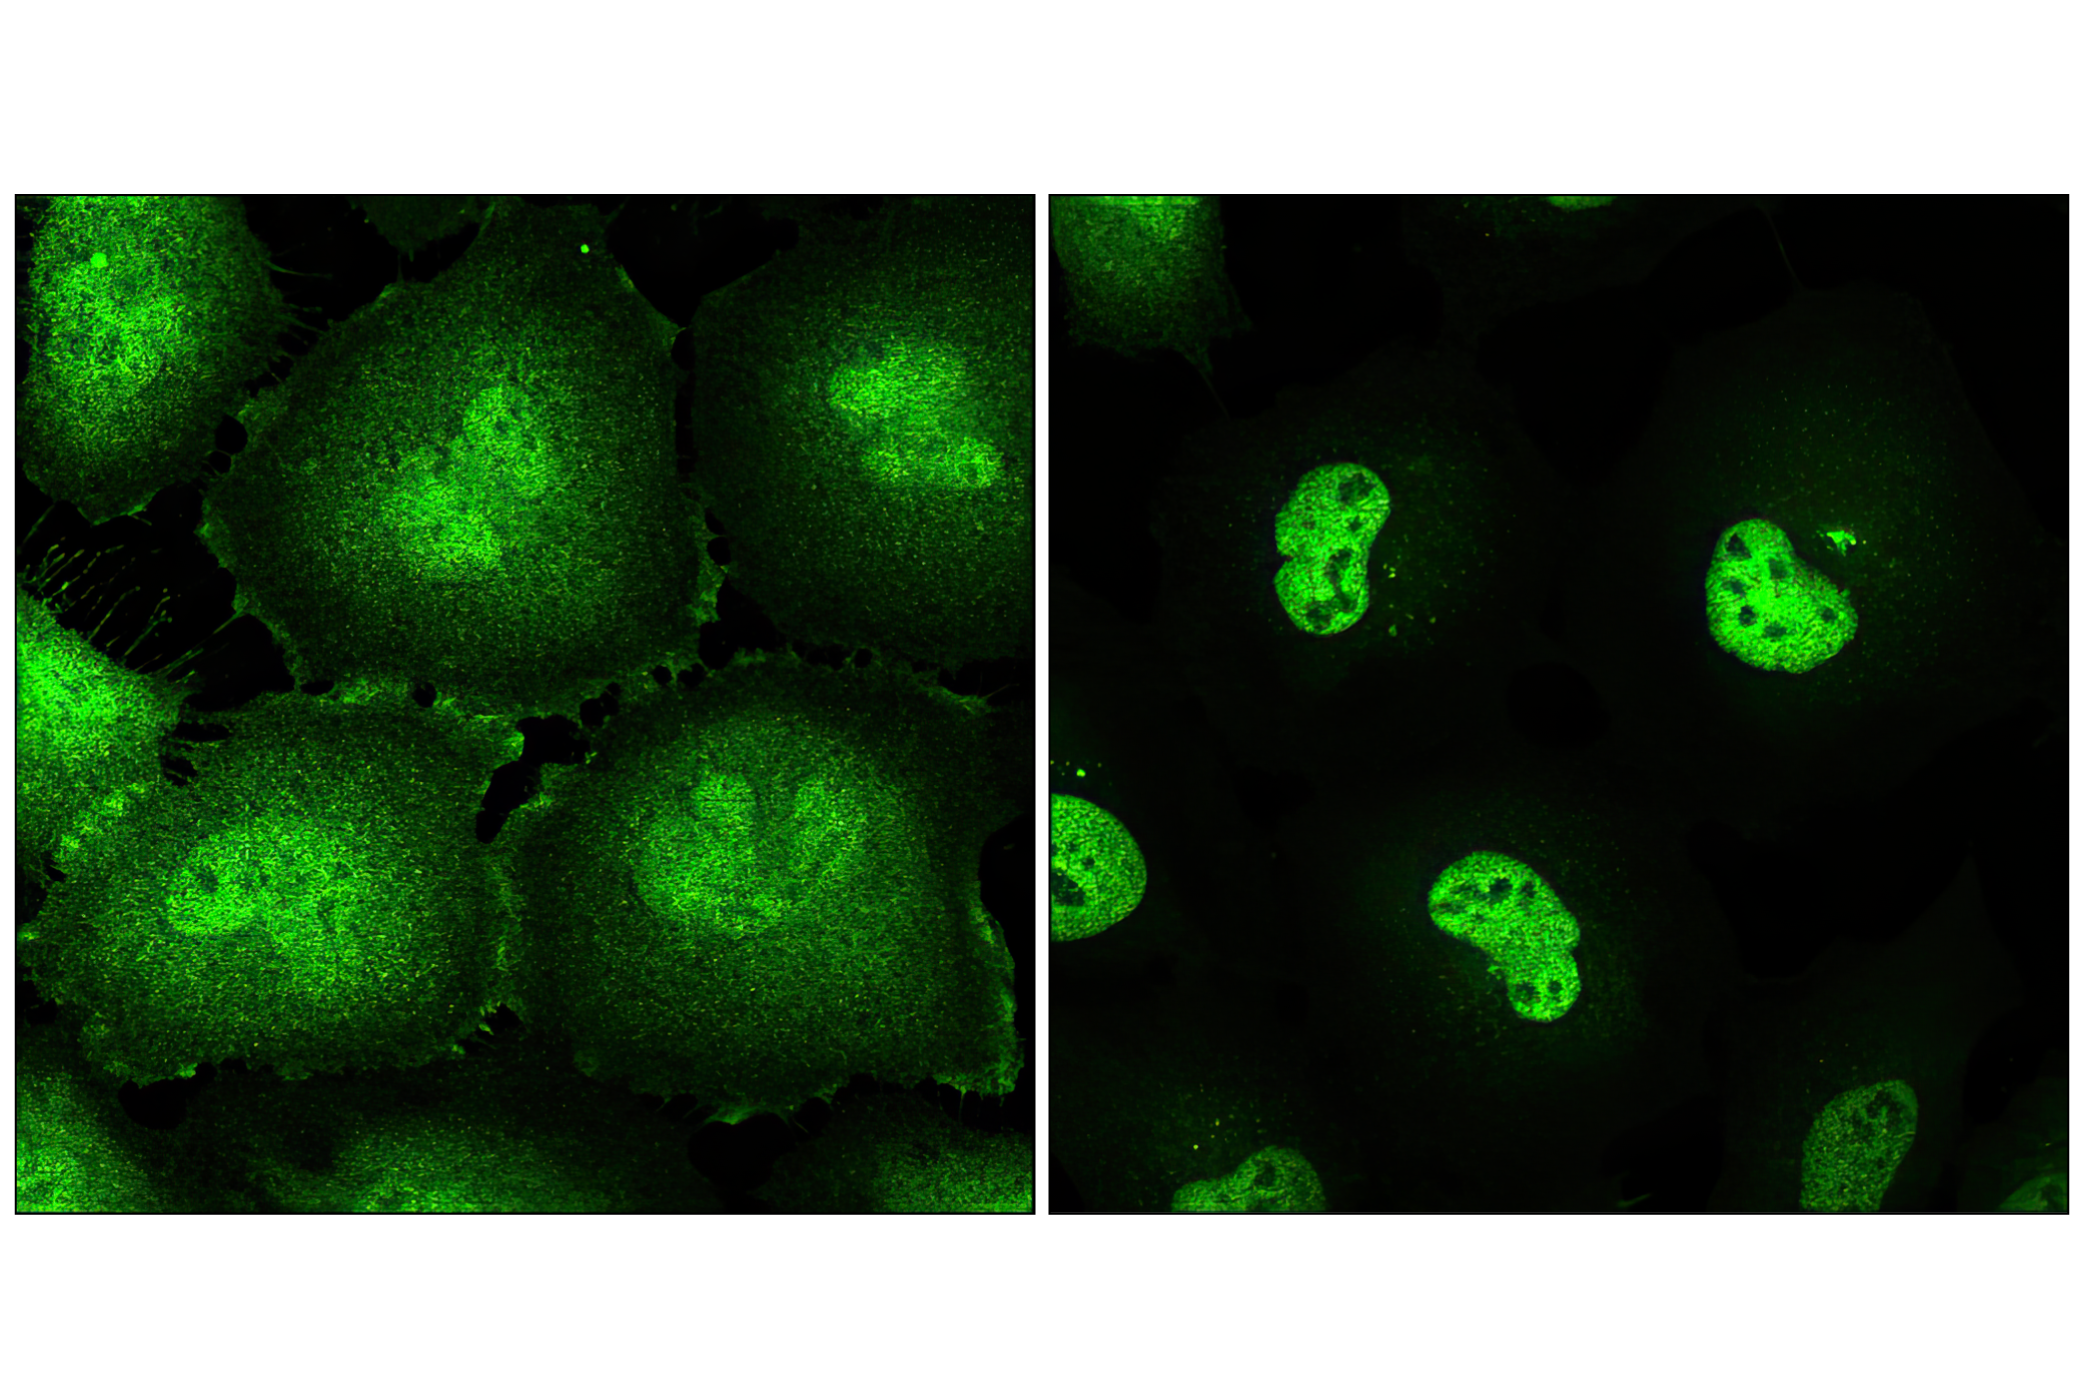
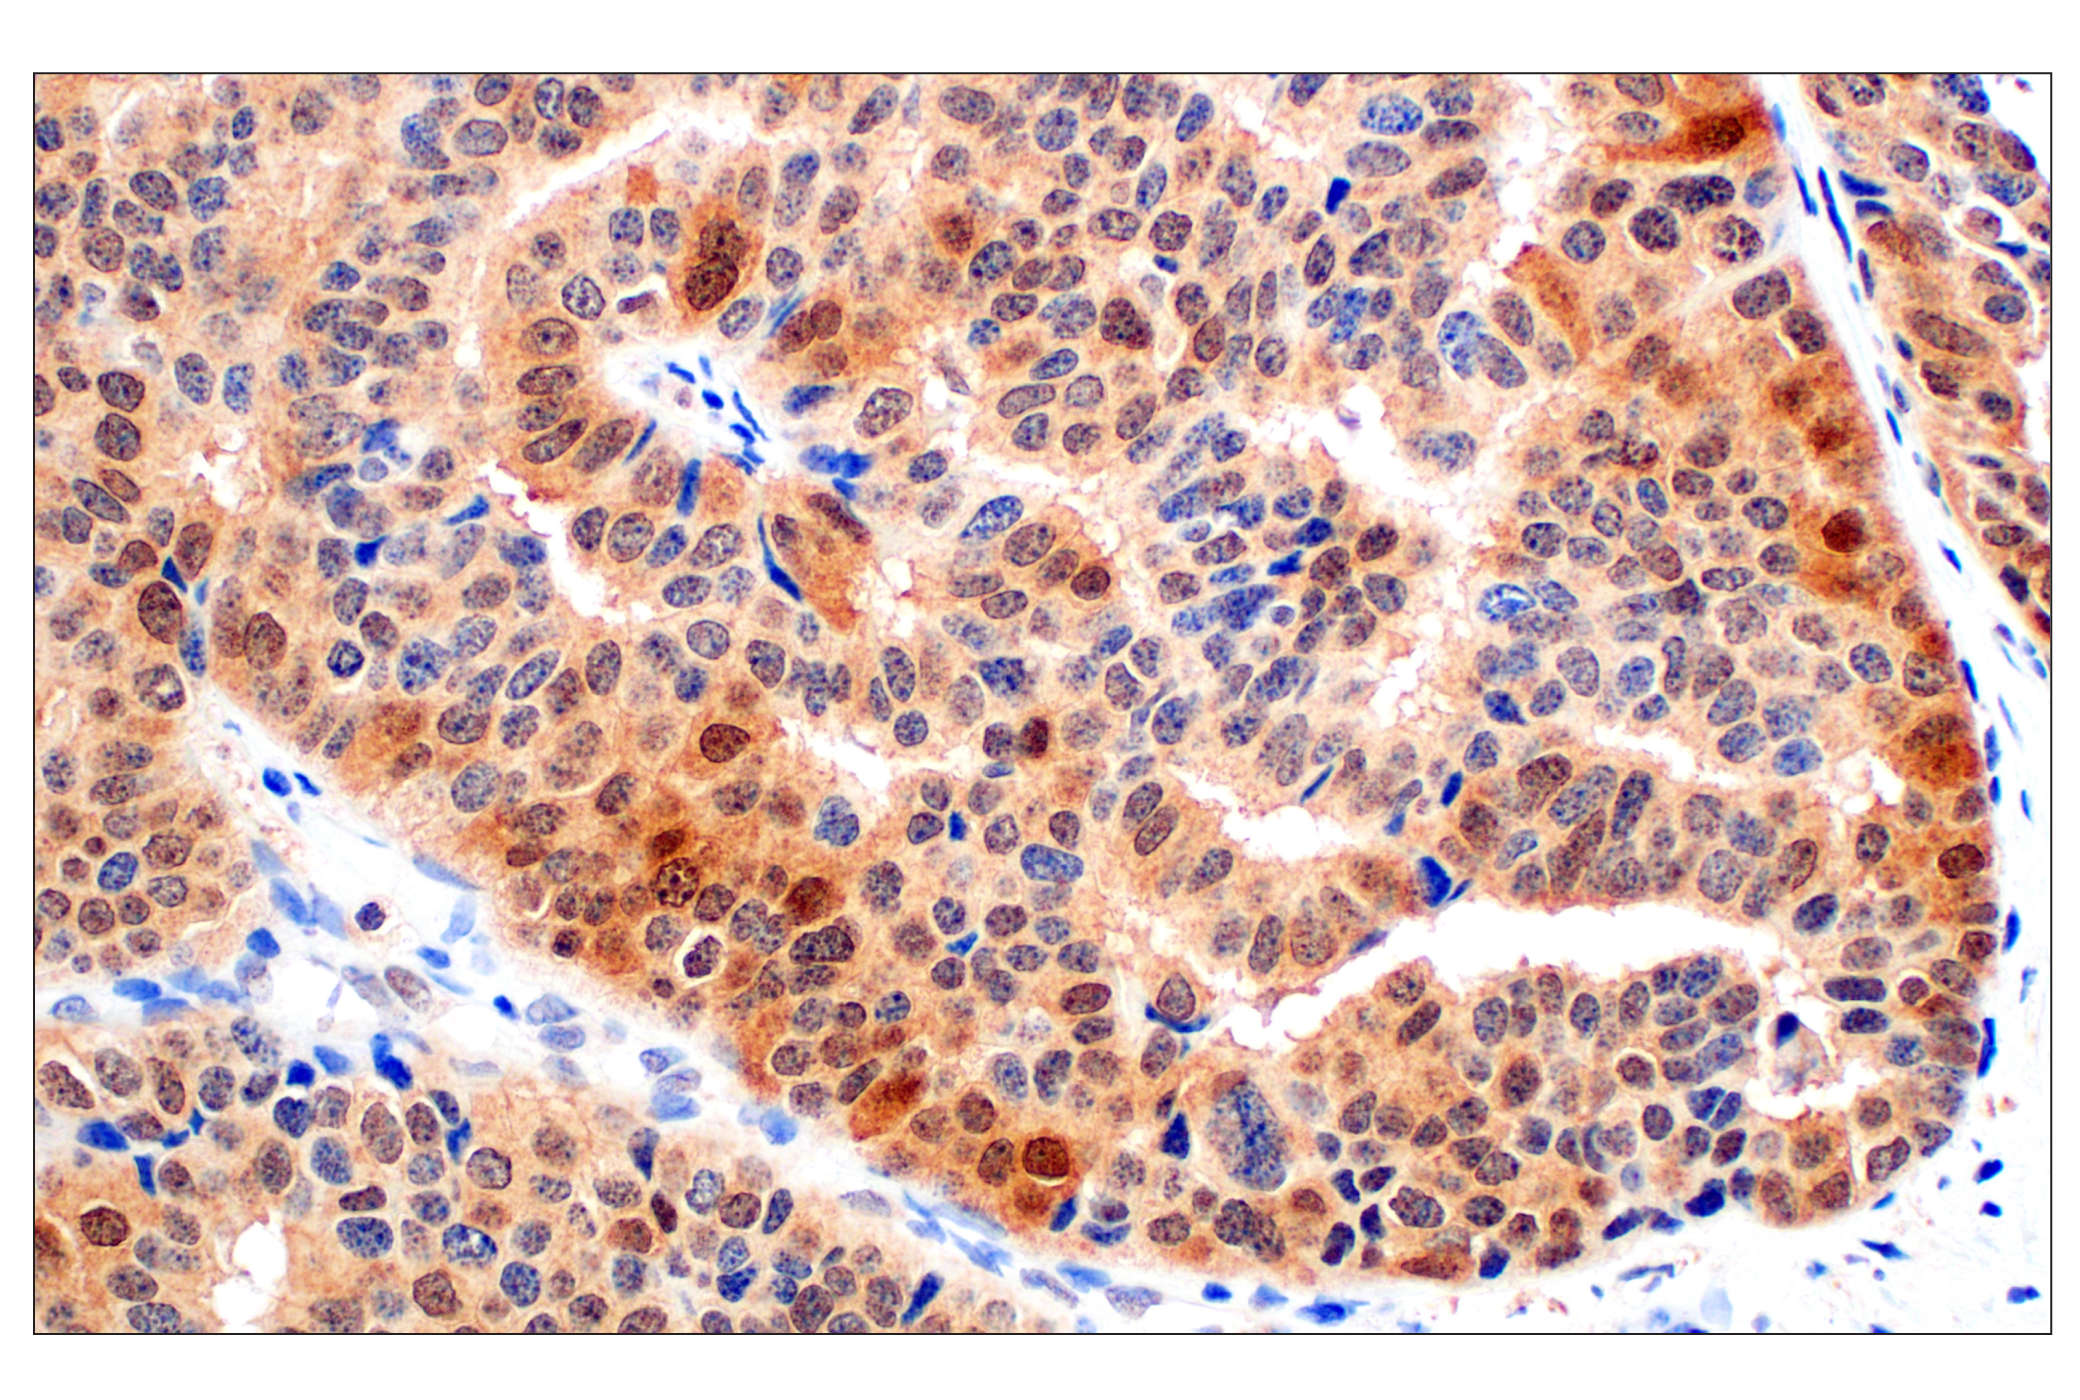
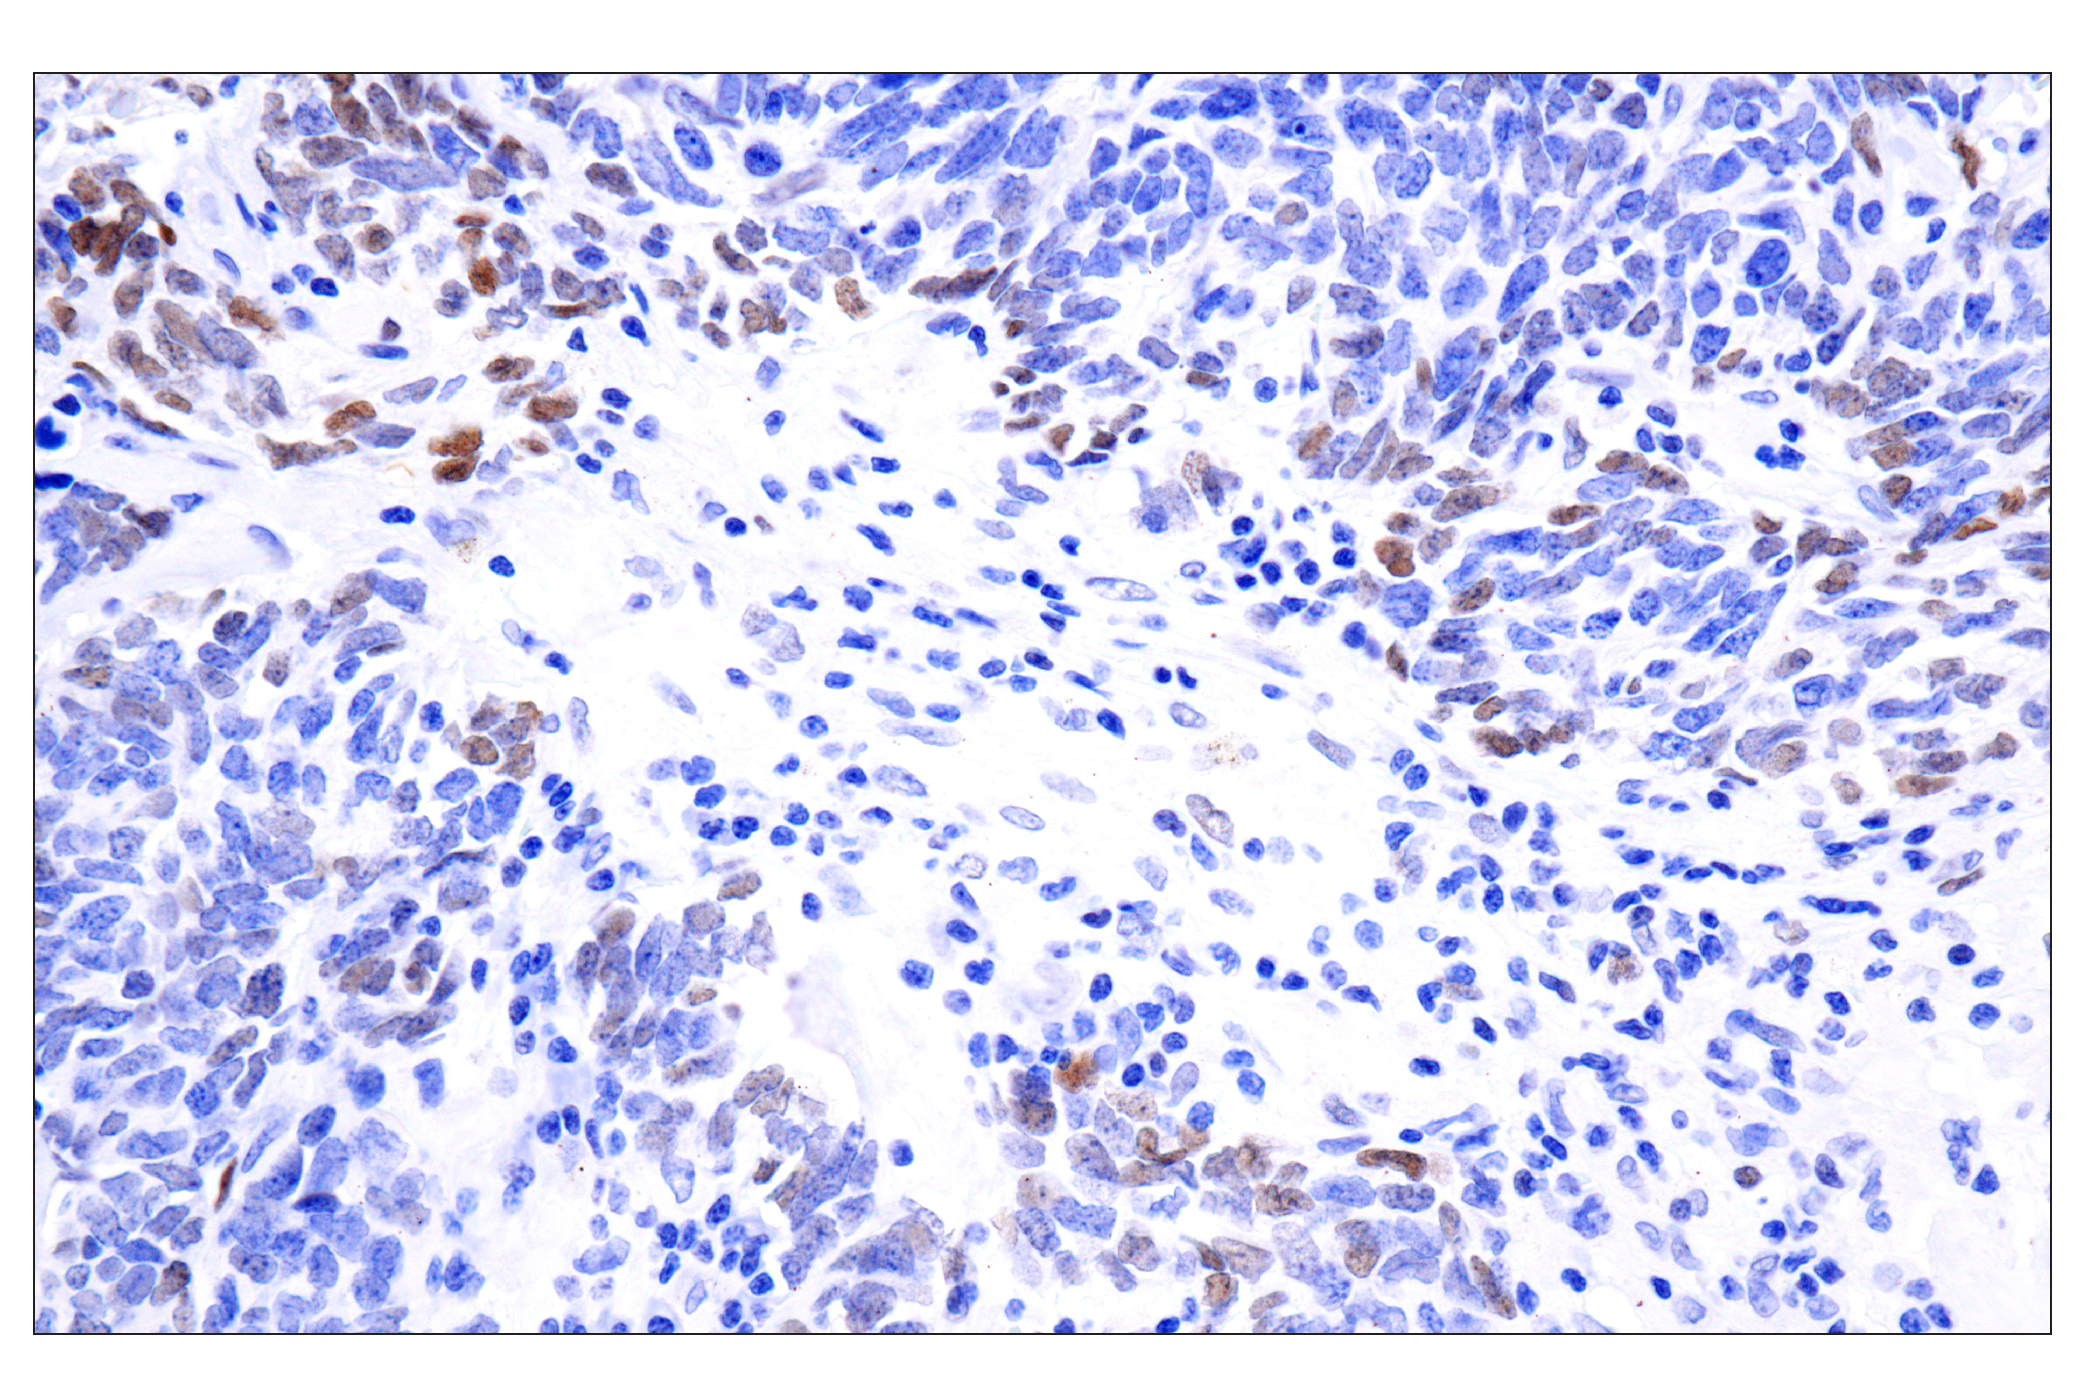
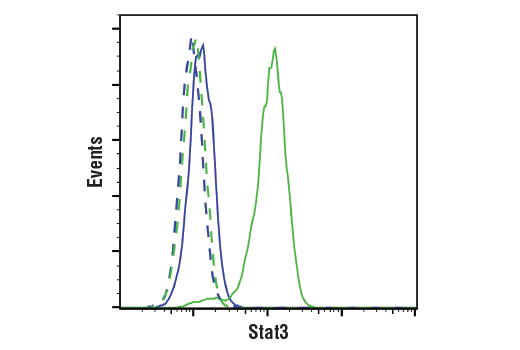
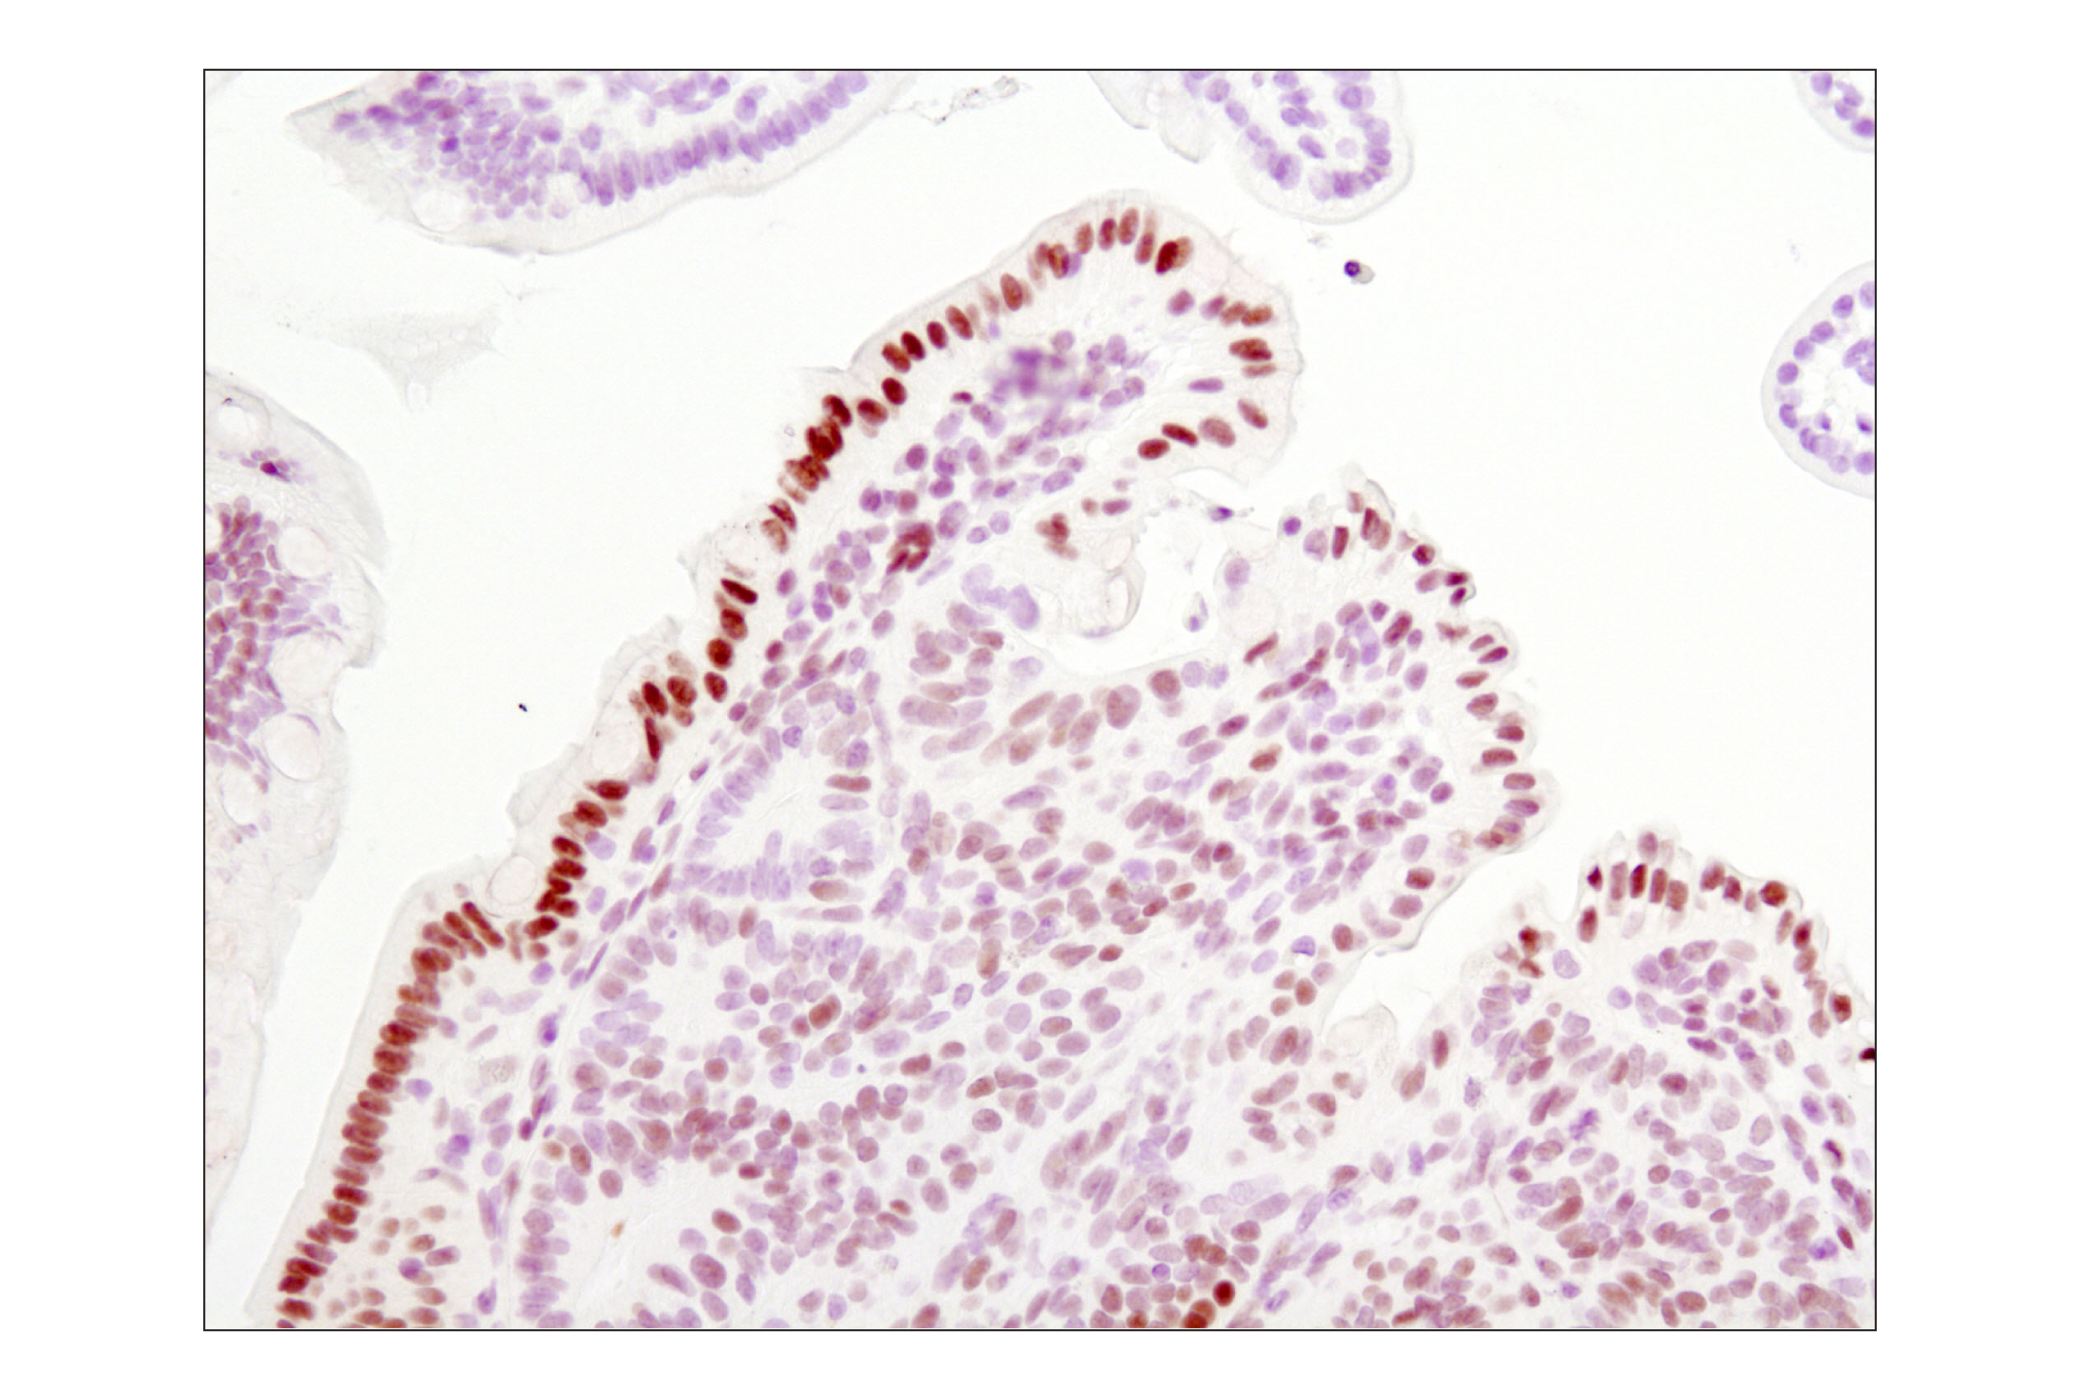
Monoclonal antibodies are produced by immunizing animals with either a synthetic phosphopeptide corresponding to residues surrounding Tyr705 of mouse Stat3 or with a synthetic peptide corresponding to the sequence of mouse Stat3.

Background

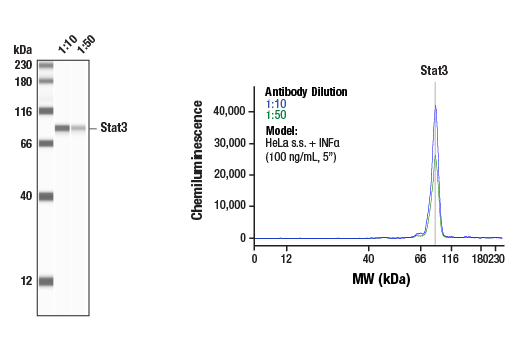
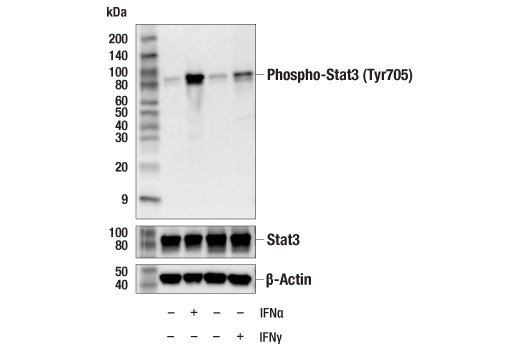
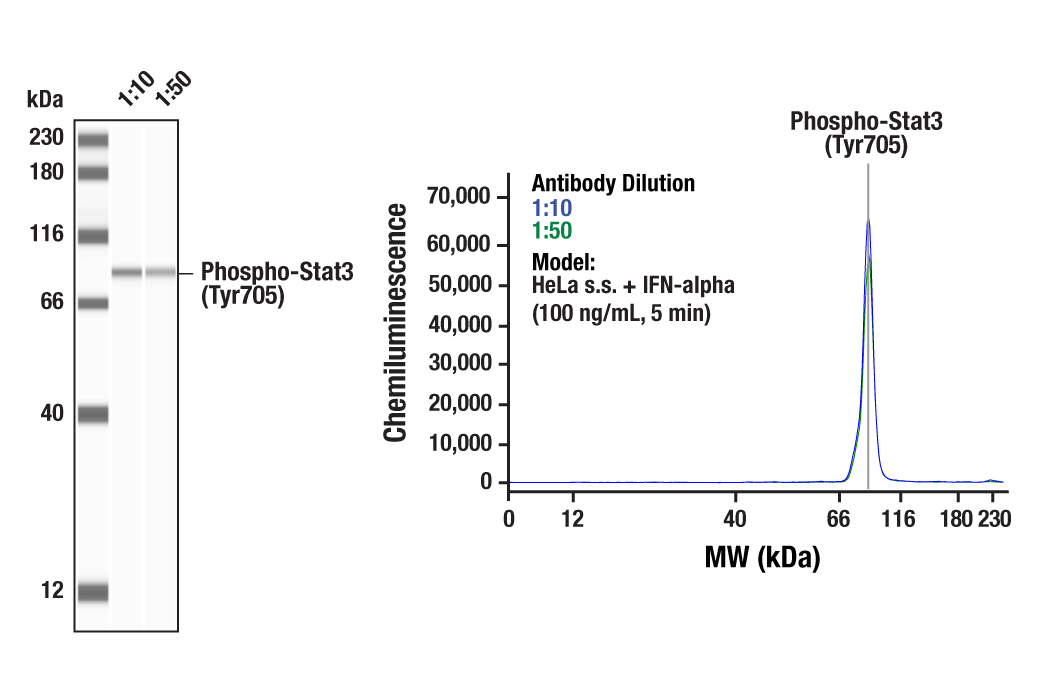
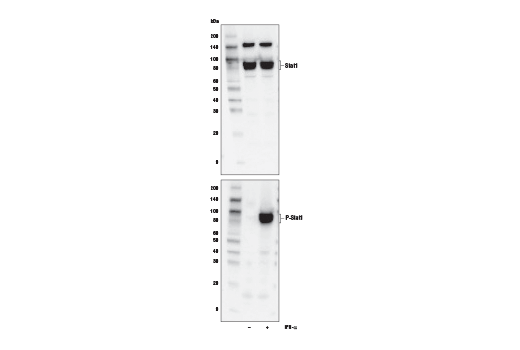
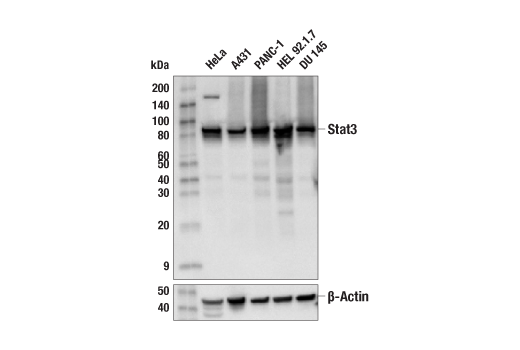
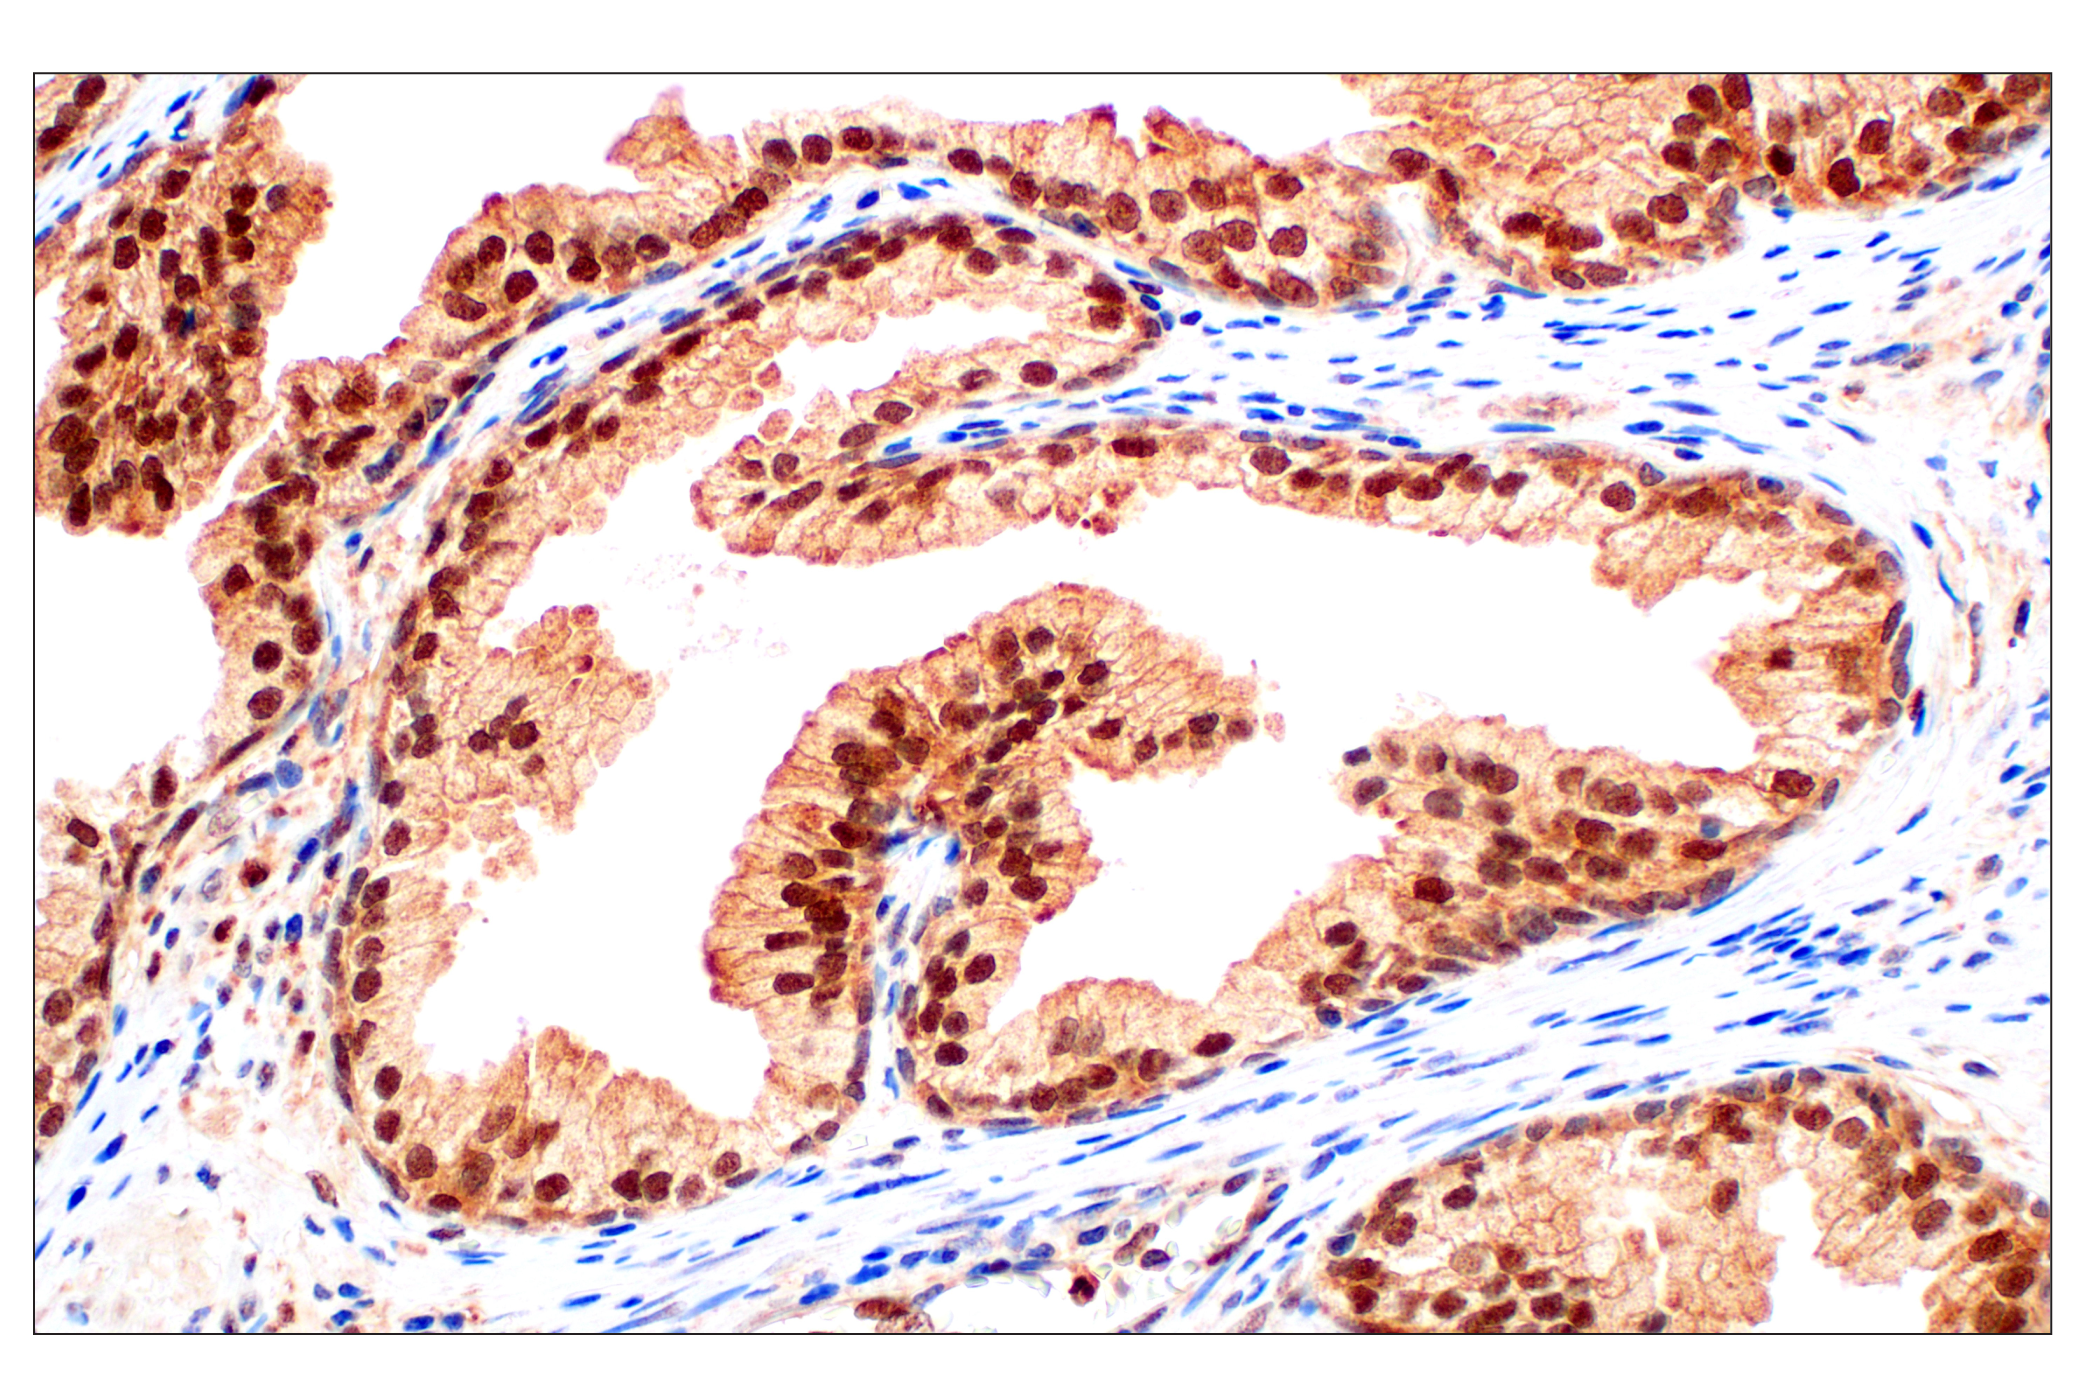
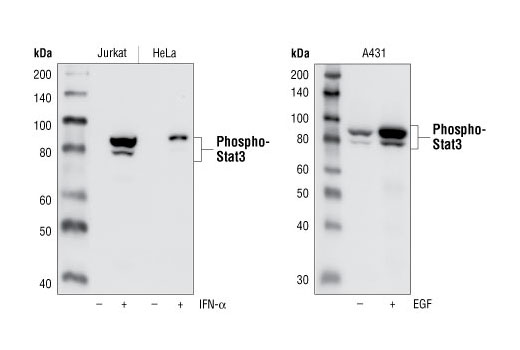
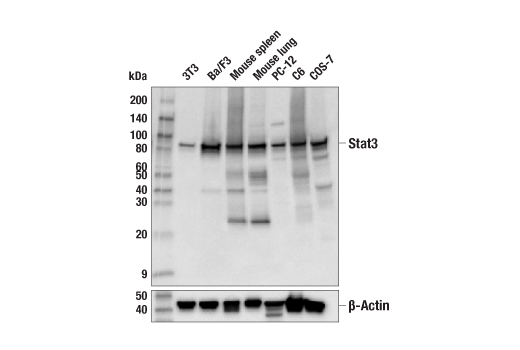
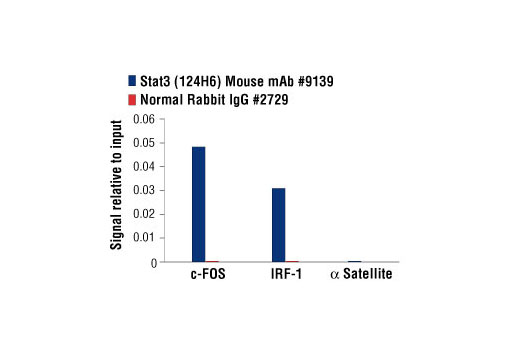
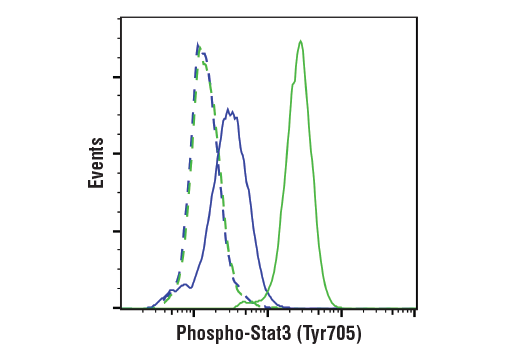
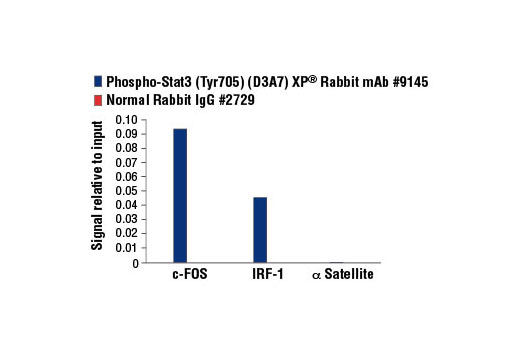
The Stat3 transcription factor is an important signaling molecule for many cytokines and growth factor receptors (1) and is required for murine fetal development (2). Research studies have shown that Stat3 is constitutively activated in a number of human tumors (3,4) and possesses oncogenic potential (5) and anti-apoptotic activities (3). Stat3 is activated by phosphorylation at Tyr705, which induces dimerization, nuclear translocation, and DNA binding (6,7). Transcriptional activation seems to be regulated by phosphorylation at Ser727 through the MAPK or mTOR pathways (8,9). Stat3 isoform expression appears to reflect biological function as the relative expression levels of Stat3α (86 kDa) and Stat3β (79 kDa) depend on cell type, ligand exposure, or cell maturation stage (10). It is notable that Stat3β lacks the serine phosphorylation site within the carboxy-terminal transcriptional activation domain (8).

Pathways

Explore pathways related to this product.

Limited Uses

Except as otherwise expressly agreed in a writing signed by a legally authorized representative of CST, the following terms apply to Products provided by CST, its affiliates or its distributors. Any Customer's terms and conditions that are in addition to, or different from, those contained herein, unless separately accepted in writing by a legally authorized representative of CST, are rejected and are of no force or effect.

Products are labeled with For Research Use Only or a similar labeling statement and have not been approved, cleared, or licensed by the FDA or other regulatory foreign or domestic entity, for any purpose. Customer shall not use any Product for any diagnostic or therapeutic purpose, or otherwise in any manner that conflicts with its labeling statement. Products sold or licensed by CST are provided for Customer as the end-user and solely for research and development uses. Any use of Product for diagnostic, prophylactic or therapeutic purposes, or any purchase of Product for resale (alone or as a component) or other commercial purpose, requires a separate license from CST. Customer shall (a) not sell, license, loan, donate or otherwise transfer or make available any Product to any third party, whether alone or in combination with other materials, or use the Products to manufacture any commercial products, (b) not copy, modify, reverse engineer, decompile, disassemble or otherwise attempt to discover the underlying structure or technology of the Products, or use the Products for the purpose of developing any products or services that would compete with CST products or services, (c) not alter or remove from the Products any trademarks, trade names, logos, patent or copyright notices or markings, (d) use the Products solely in accordance with CST Product Terms of Sale and any applicable documentation, and (e) comply with any license, terms of service or similar agreement with respect to any third party products or services used by Customer in connection with the Products.

For Research Use Only. Not for Use in Diagnostic Procedures.
Cell Signaling Technology is a trademark of Cell Signaling Technology, Inc.
PhosphoPlus is a registered trademark of Cell Signaling Technology, Inc.
All other trademarks are the property of their respective owners. Visit our Trademark Information page.