Revision 2
#63734
Store at -20C
TFEB Signaling Antibody Sampler Kit
1 Kit
(6 x 20 microliters)
877-616-CELL (2355)
877-678-TECH (8324)
3 Trask Lane | Danvers | Massachusetts | 01923 | USA
For Research Use Only. Not for Use in Diagnostic Procedures.
| Product Includes | Product # | Quantity | Mol. Wt | Isotype/Source |
|---|---|---|---|---|
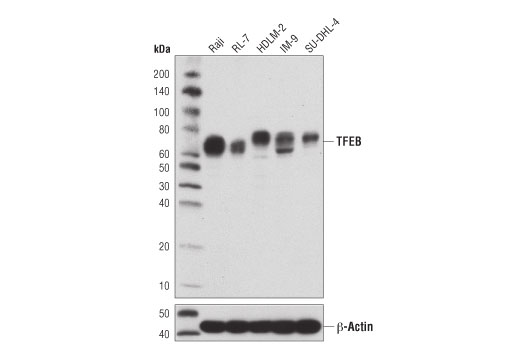
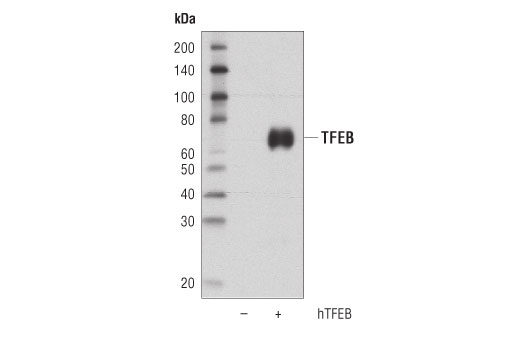
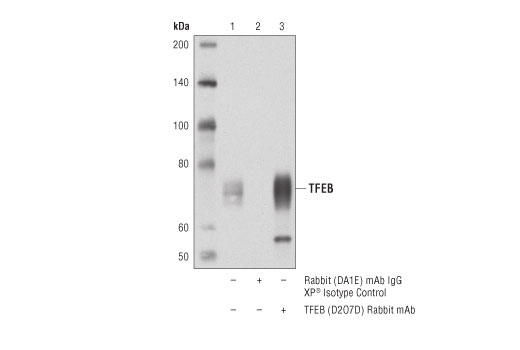
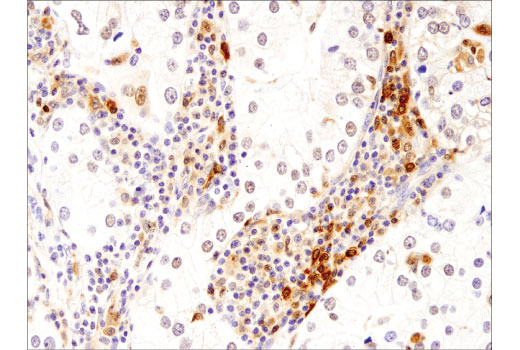
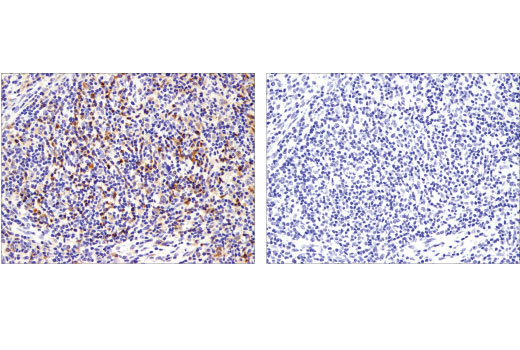
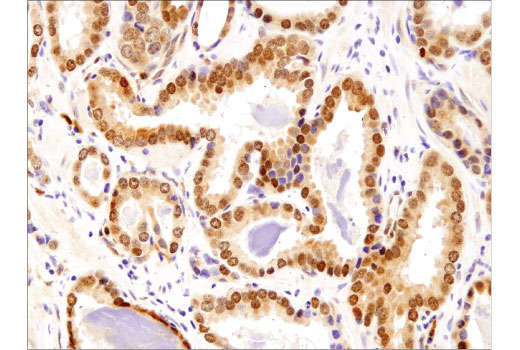
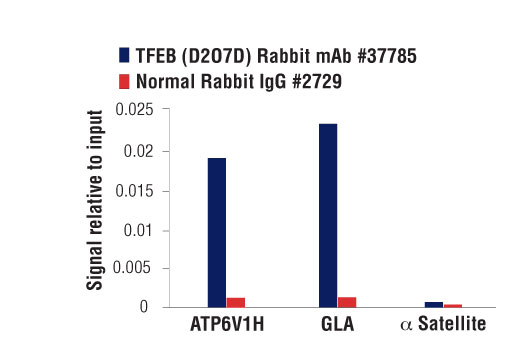
| TFEB (D2O7D) Rabbit Monoclonal Antibody | 37785 | 20 µl | 65-70 kDa | Rabbit IgG |
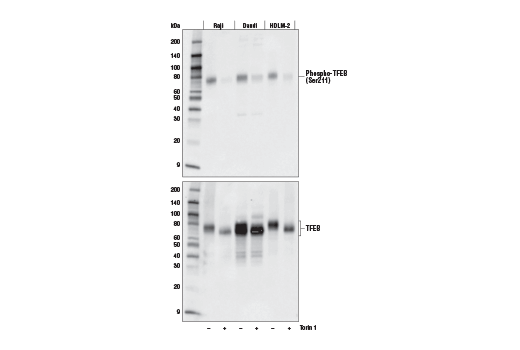
| Phospho-TFEB (Ser211) (E9S8N) Rabbit Monoclonal Antibody | 37681 | 20 µl | 70 kDa | Rabbit IgG |
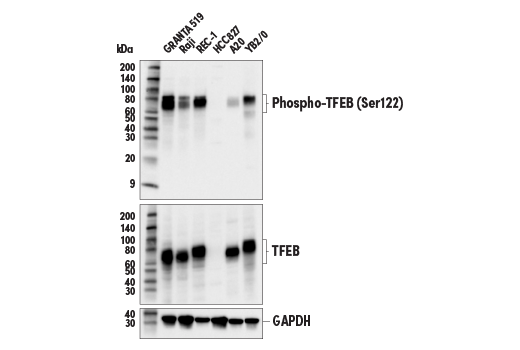
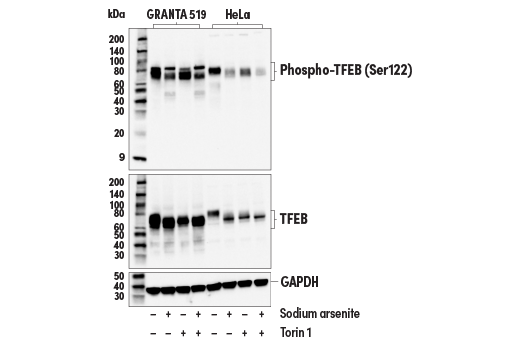
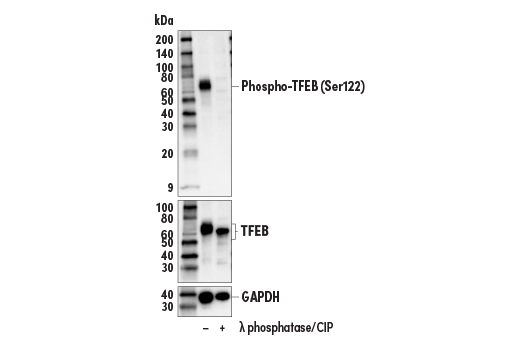
| Phospho-TFEB (Ser122) (E9M5M) Rabbit Monoclonal Antibody | 87932 | 20 µl | 70-80 kDa | Rabbit IgG |
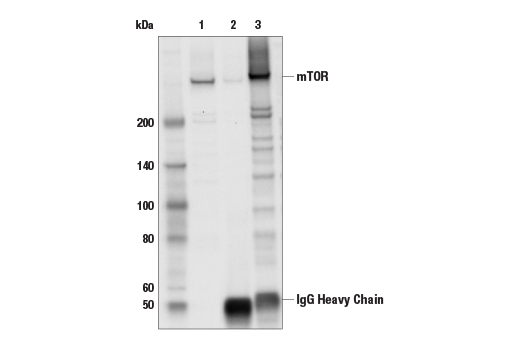
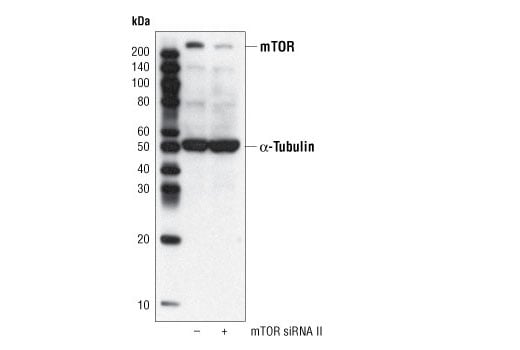
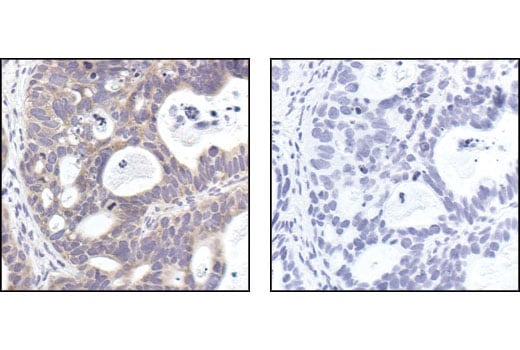
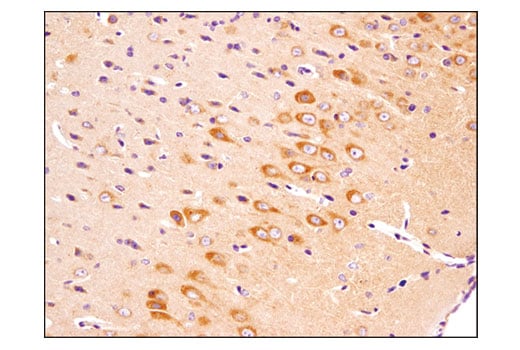
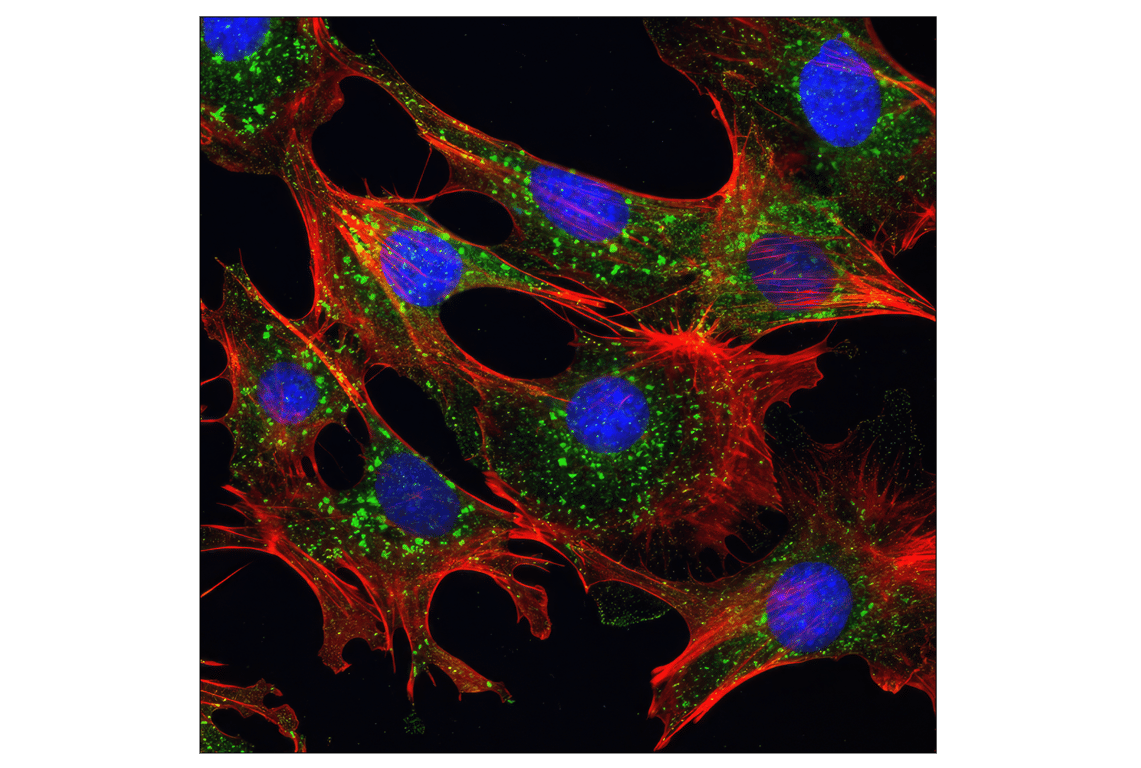
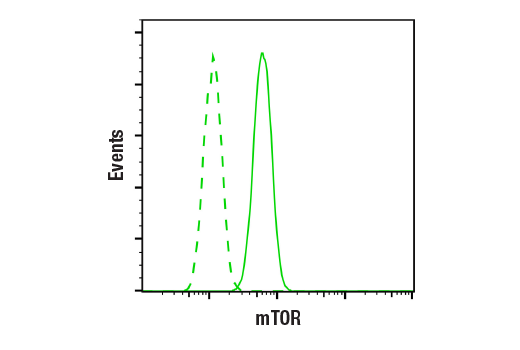
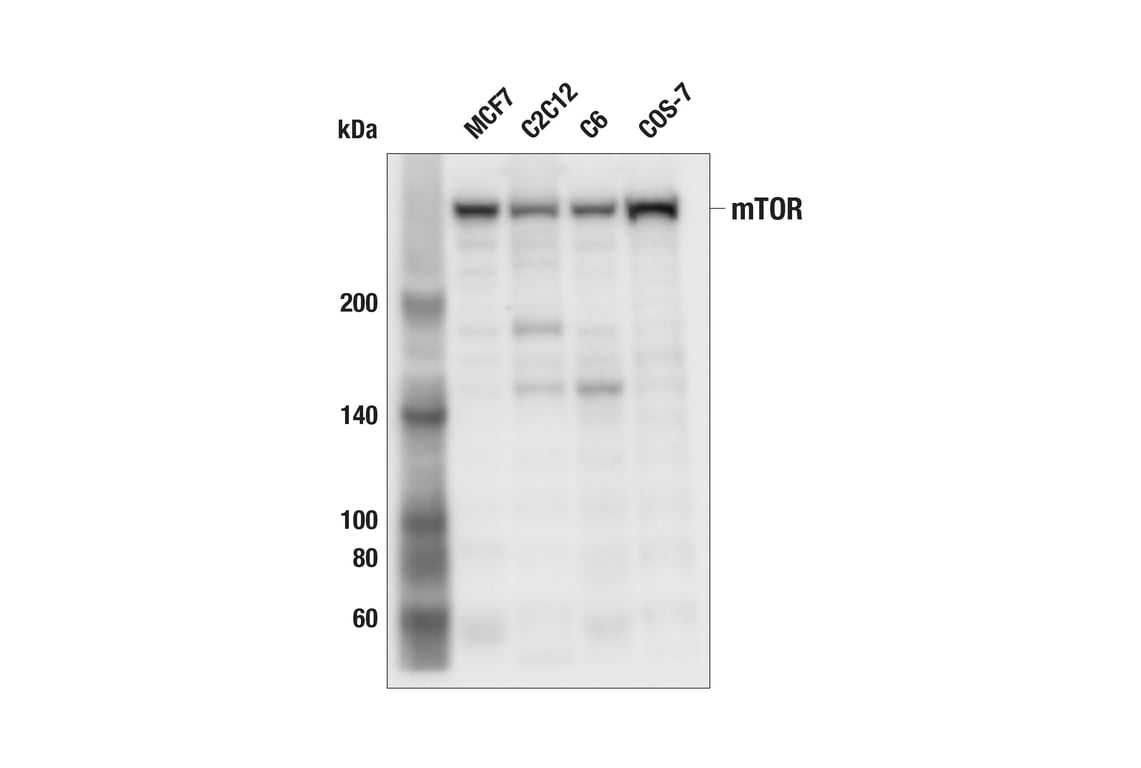
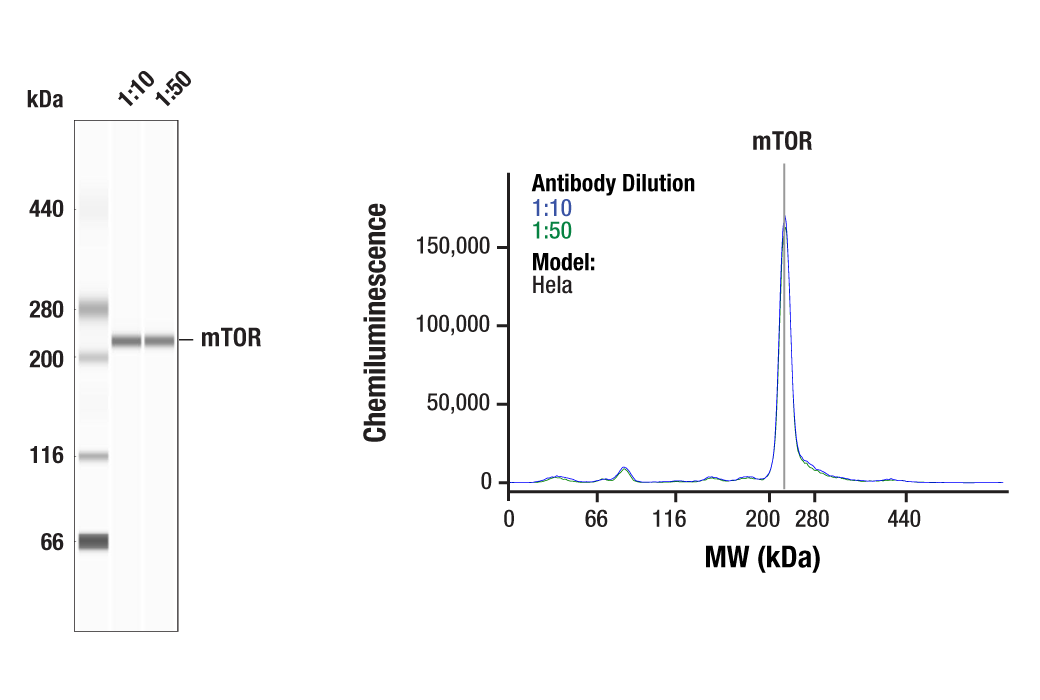
| mTOR (7C10) Rabbit Monoclonal Antibody | 2983 | 20 µl | 289 kDa | Rabbit IgG |
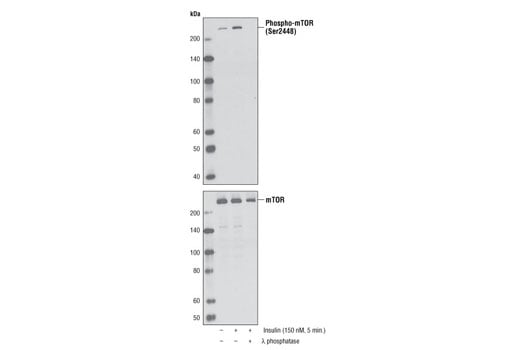
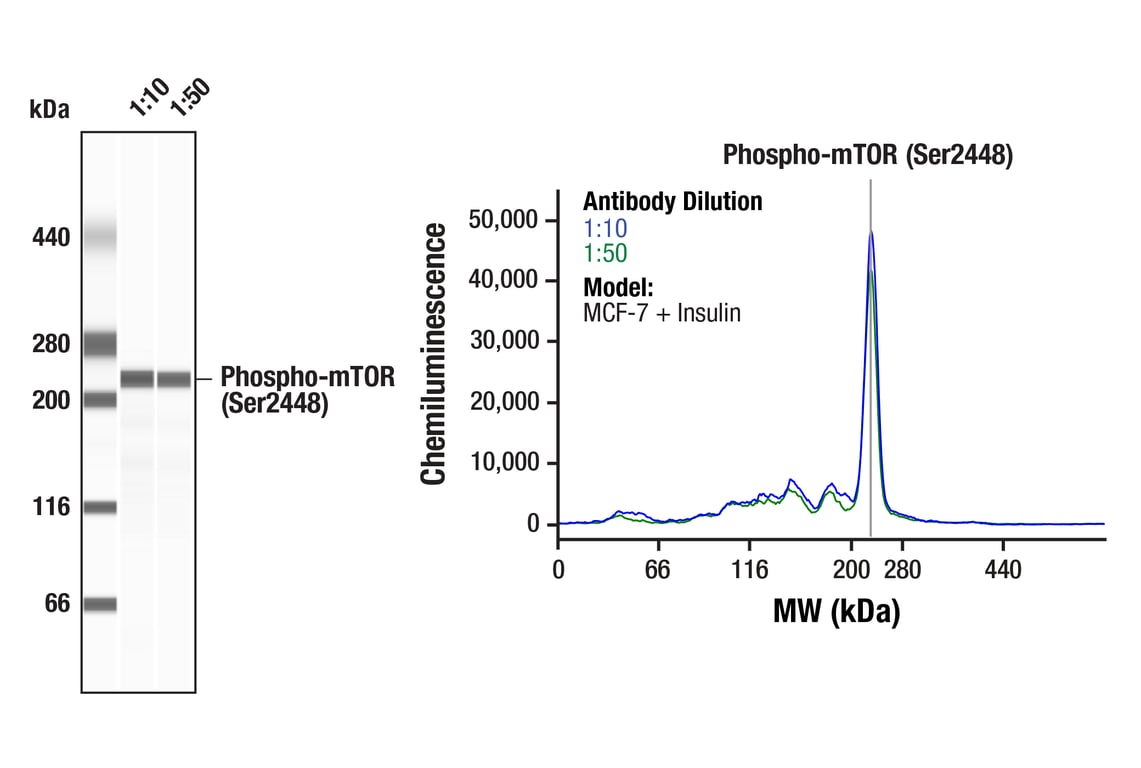
| Phospho-mTOR (Ser2448) (D9C2) Rabbit Monoclonal Antibody | 5536 | 20 µl | 289 kDa | Rabbit IgG |
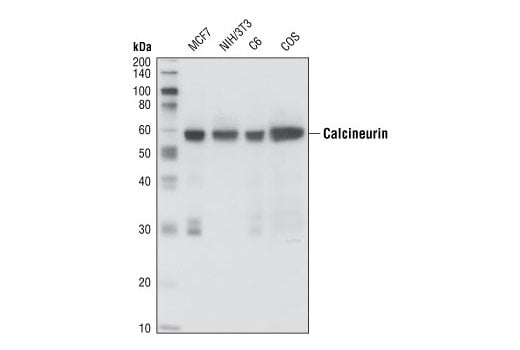
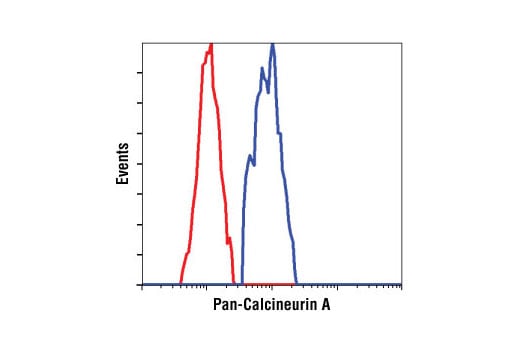
| Pan-Calcineurin A Antibody | 2614 | 20 µl | 59 kDa | Rabbit |
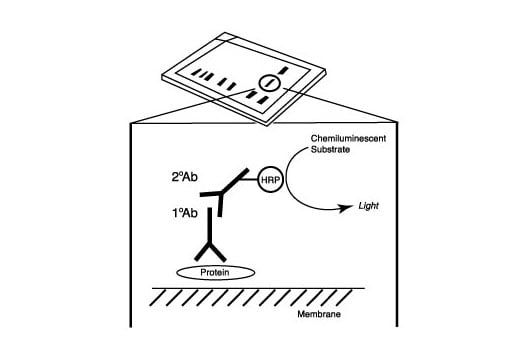
| Anti-rabbit IgG, HRP-linked Antibody | 7074 | 100 µl | Goat |
Please visit cellsignal.com for individual component applications, species cross-reactivity, dilutions, protocols, and additional product information.
Description
Storage
Background
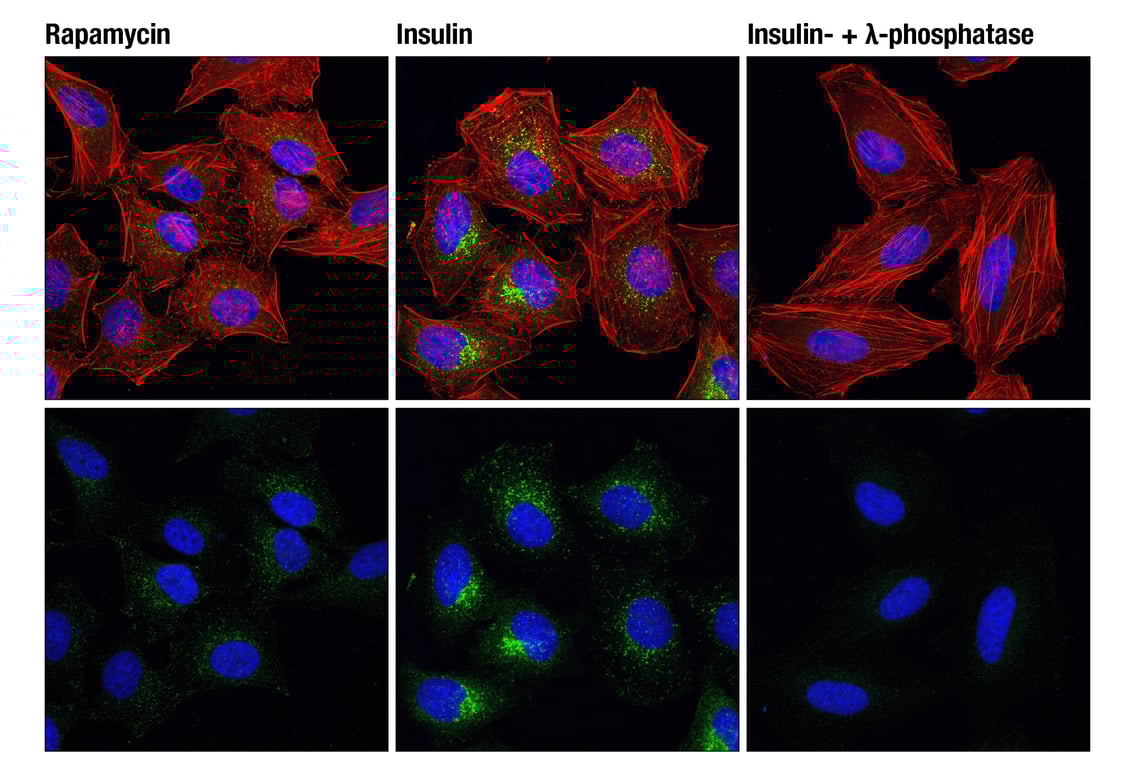
Additional studies have also identified phosphorylation of TFEB at Ser122 that is dependent on mTORC1 (11). mTOR activity is associated with phosphorylation at Ser2448 via the PI3 kinase/Akt signaling pathway (12). Lysosomal calcium release activates the phosphatase calcineurin that dephosphorylates TFEB and promotes nuclear translocation and autophagy (13).
Background References
- Sardiello, M. et al. (2009) Science 325, 473-7.
- Sardiello, M. and Ballabio, A. (2009) Cell Cycle 8, 4021-2.
- Settembre, C. et al. (2011) Science 332, 1429-33.
- David, R. (2011) Nat Rev Mol Cell Biol 12, 404.
- Cuervo, A.M. (2011) Science 332, 1392-3.
- Peña-Llopis, S. et al. (2011) EMBO J 30, 3242-58.
- Settembre, C. and Ballabio, A. (2011) Autophagy 7, 1379-81.
- Peña-Llopis, S. and Brugarolas, J. (2011) Cell Cycle 10, 3987-8.
- Settembre, C. et al. (2012) EMBO J 31, 1095-108.
- Martina, J.A. et al. (2012) Autophagy 8, 903-14.
- Vega-Rubin-de-Celis, S. et al. (2017) Autophagy 13, 464-472.
- Navé, B.T. et al. (1999) Biochem J 344 Pt 2, 427-31.
- Medina, D.L. et al. (2015) Nat Cell Biol 17, 288-99.
Trademarks and Patents
Cell Signaling Technology is a trademark of Cell Signaling Technology, Inc.
All other trademarks are the property of their respective owners. Visit cellsignal.com/trademarks for more information.
Limited Uses
Except as otherwise expressly agreed in a writing signed by a legally authorized representative of CST, the following terms apply to Products provided by CST, its affiliates or its distributors. Any Customer's terms and conditions that are in addition to, or different from, those contained herein, unless separately accepted in writing by a legally authorized representative of CST, are rejected and are of no force or effect.
Products are labeled with For Research Use Only or a similar labeling statement and have not been approved, cleared, or licensed by the FDA or other regulatory foreign or domestic entity, for any purpose. Customer shall not use any Product for any diagnostic or therapeutic purpose, or otherwise in any manner that conflicts with its labeling statement. Products sold or licensed by CST are provided for Customer as the end-user and solely for research and development uses. Any use of Product for diagnostic, prophylactic or therapeutic purposes, or any purchase of Product for resale (alone or as a component) or other commercial purpose, requires a separate license from CST. Customer shall (a) not sell, license, loan, donate or otherwise transfer or make available any Product to any third party, whether alone or in combination with other materials, or use the Products to manufacture any commercial products, (b) not copy, modify, reverse engineer, decompile, disassemble or otherwise attempt to discover the underlying structure or technology of the Products, or use the Products for the purpose of developing any products or services that would compete with CST products or services, (c) not alter or remove from the Products any trademarks, trade names, logos, patent or copyright notices or markings, (d) use the Products solely in accordance with CST Product Terms of Sale and any applicable documentation, and (e) comply with any license, terms of service or similar agreement with respect to any third party products or services used by Customer in connection with the Products.
Revision 2
Revision 2
Revision 2
Revision 2
Revision 2
Revision 2
Revision 2
Revision 2
Revision 2
Revision 2